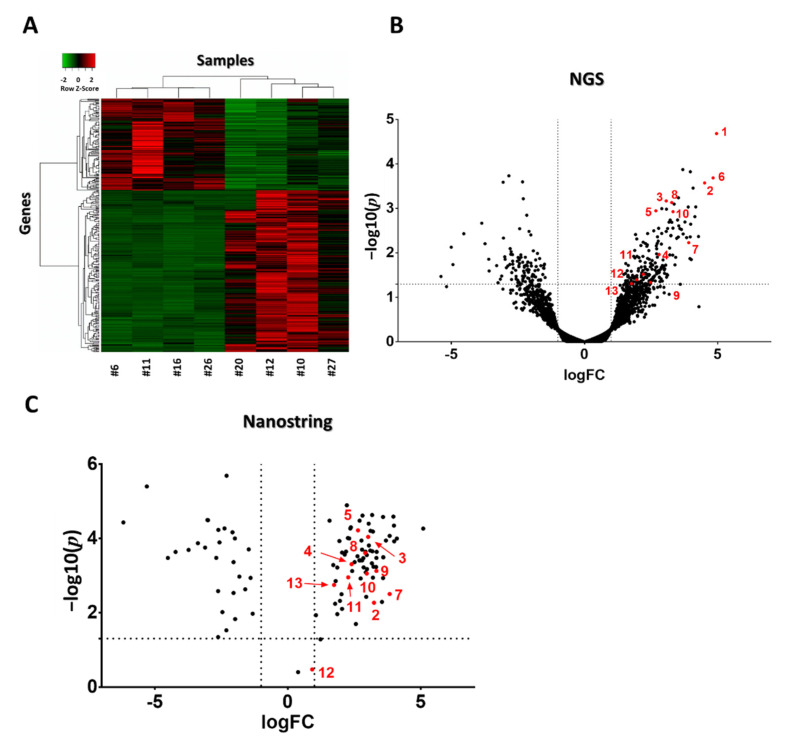
Figure 5.
Heat map and volcano plot visualization of DE genes after three mEHT treatments. Heat map clusterization with dendograms (Kendall tau’s method, dendogram details: Figure S2) of differentially expressed (DE) genes according to the next generation sequencing (NGS) RNA seq data. Columns represent samples, rows represent genes. Red = upregulation, green = downregulation (A). Volcano plot of all genes according to the NGS RNA seq data (B). Volcano plot of DE genes from the Nanostring data (C). (B,C) −log10(p) values plotted against fold changes (logFC). Vertical dotted line: logFC = 1, horizontal dotted line: −log10(p) = 1.30103. n = 4–6/group. Red dots with numbers mark genes identified in Table 1. Cell line: 4T1, 3× treated.

