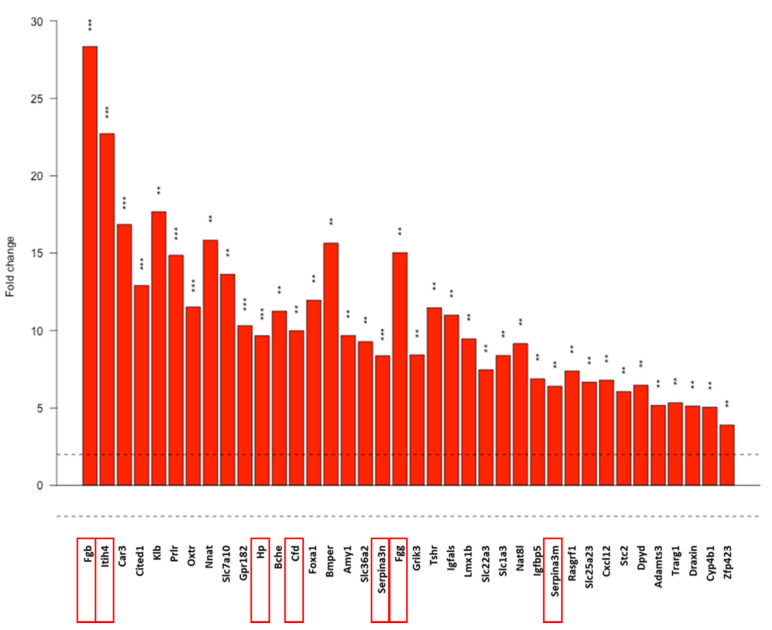
Figure 6.
Response to stimulus pathway based on the gene-ontology (GO) analysis of the NGS data. Dotted line: FC = 2. Red frames: further analyed genes. Gene names, p values and further pathways containing stress-related genes analyzed with the DEListEnrichment_upR module are presented in Table S2. **: p < 0.01, ***: p < 0.001. Cell line: 4T1, 3× treated.

