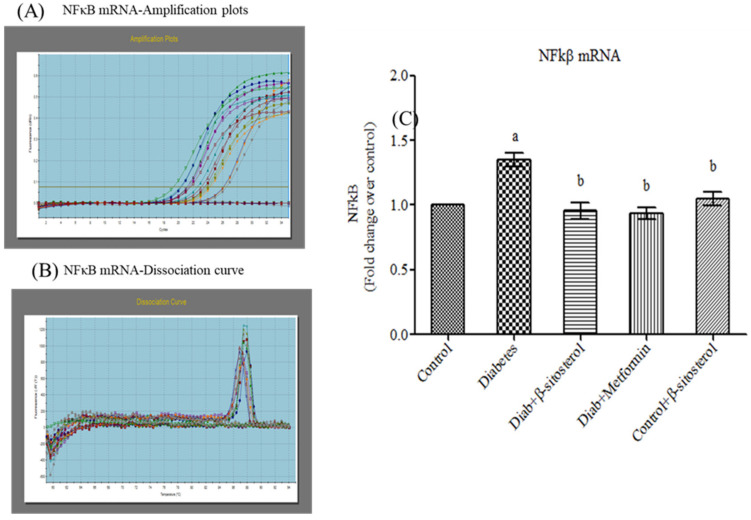
Figure 11.
Effect of SIT on mRNA expression of NF-κB in adipose tissue of type-2 diabetic rats. The mRNA expression of NF-κB was assessed by real time-PCR. (A): Amplification plots; (B): dissociation curve analysis confirms the single product of NF-κB mRNA and (C): mRNA expression is given in fold change. Each bar represents mean ± SEM (n = 6). Significance at p < 0.05. a Significantly different from the control group; b significantly different from the diabetic control.

