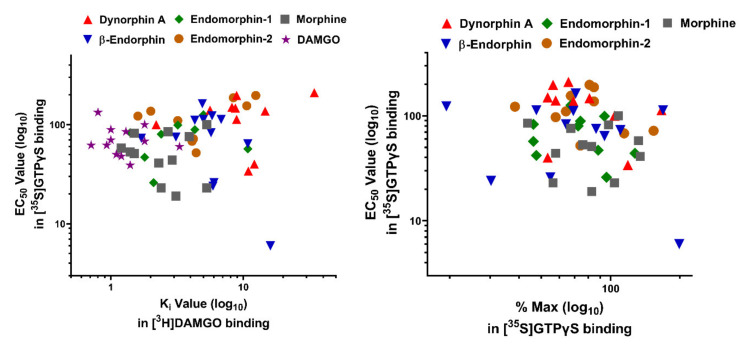
Figure 3.
Correlation of the EC50 values with % maximum stimulation (% Max) in [35S]GTPγS binding and with the Ki values in receptor binding among mouse Oprm1 7TM C-terminal variants. A). Correlations of the Ki values in receptor binding from Table 2 with the EC50 values in [35S]GTPγS binding from Table 3. Correlation coefficients (r2) were calculated for each drug by linear regression (Prism 8, GraphPad). There was no significant correlation between binding site affinity (Ki) and potency (EC50) in the [35S]GTPγS binding. DAMGO, r2 = 0.03; Morphine, r2 = 0.01; β-endorphin, r2 = 0.24; Dynorphin A, r2 = 0.16; Endomorphin-1, r2 = 0.01; Endomorphin-2, r2 = 0.44. B). Correlation of the EC50 values and % maximum stimulation (% Max) in the [35S]GTPγS binding. No significant correlation between the EC50 and % Max was observed. Morphine, r2 = 0.00; β-endorphin, r2 = 0.05; Dynorphin A, r2 = 0.16; Endomorphin-1, r2 = 0.04; Endomorphin-2, r2 = 0.07.

