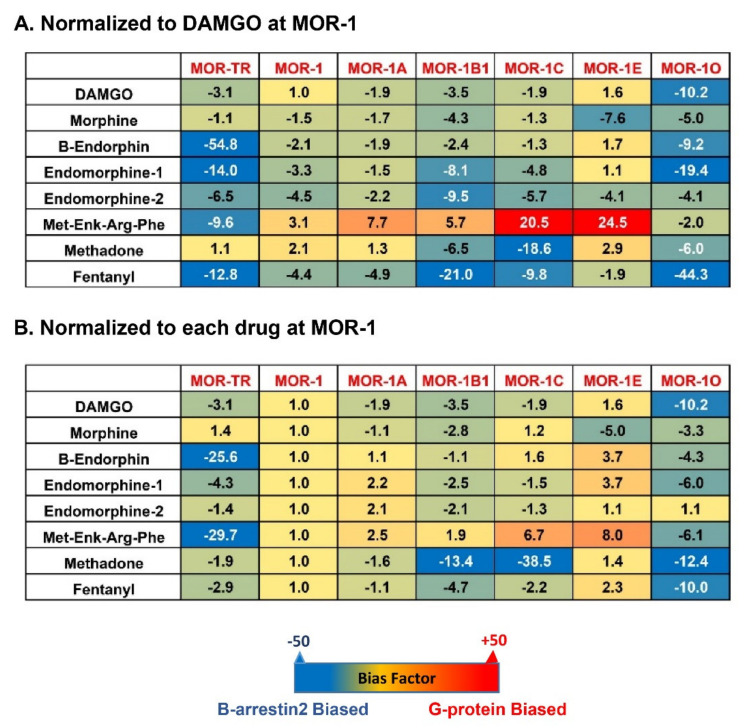
Figure 4.
Heatmap of biased factors (adopted from [81]). Biased factors were calculated using the Black and Leff Operational Model by using different normalization methods, as described in [81]. (A). Normalized with respect to DAMGO at MOR−1 for a comparison between drugs and variants. (B). Normalized with respect to each drug at mMOR−1 for a comparison across variants. The negative (blue) values indicate β-arrestin2 bias whereas the positive bias (red) values indicate G protein bias.

