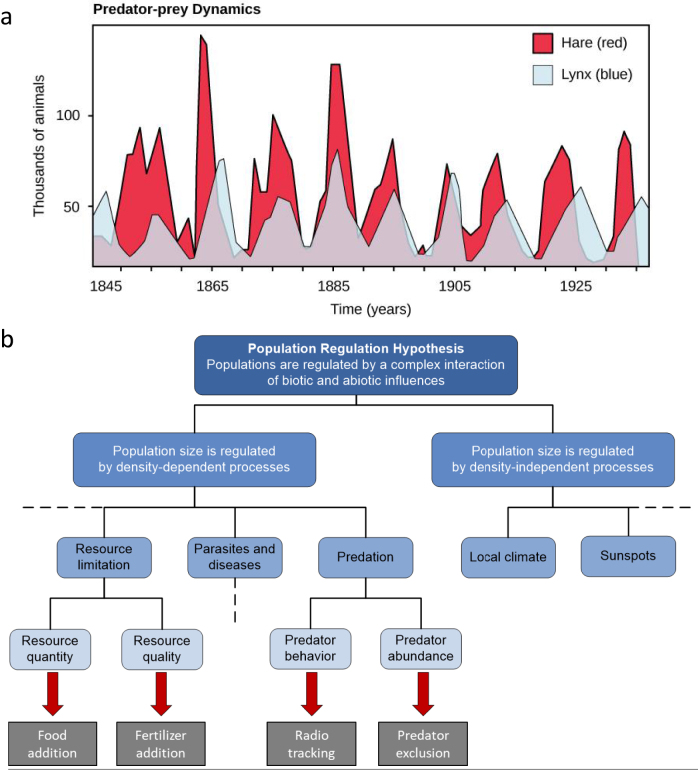
Figure 3.
(a) The population cycle of snowshoe hare and Canadian lynx and (b) a hierarchy of hypotheses illustrating its potential drivers. The hypotheses (blue boxes) branch from the overarching hypothesis into more and more precise mechanistic hypotheses and are confronted with empirical tests (arrows leading to grey boxes) at lower levels of the hierarchy. The broken lines indicate where the hierarchy may be extended. Sources: The figure is based on the summary of snowshoe hare–Canadian lynx research (Krebs et al. 2001, Krebs et al. 2018 and references therein). Panel (a) is reprinted with permission from OpenStax Biology, Chapter 45.6 Community Ecology, Rice University Publishers, Creative Commons Attribution License (by 4.0).

