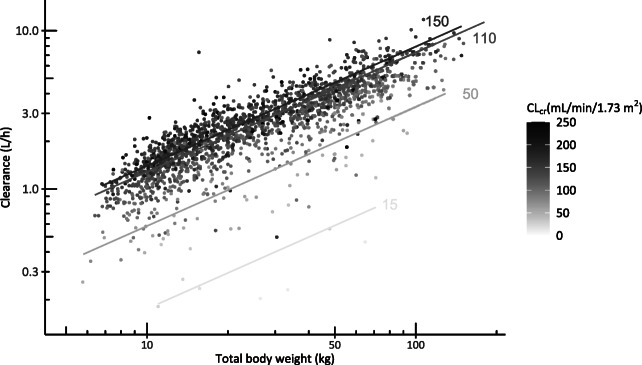
Fig. 2.
Vancomycin clearance (in L/h) versus total body weight (in kg) for varying creatinine clearance values (CLcr). Each dot represents one individual, with darker color representing a higher CLcr. The lines show how clearance changes with body weight over the available weight range according to the final model for four typical values of CLcr (i.e., 15, 50, 110, and 150 mL/min/1.73 m2), with corresponding CLcr value shown in the figure for each line (mL/min/1.73 m2). CLcr creatinine clearance based on the bedside Schwartz equation (in mL/min/1.73 m2)

