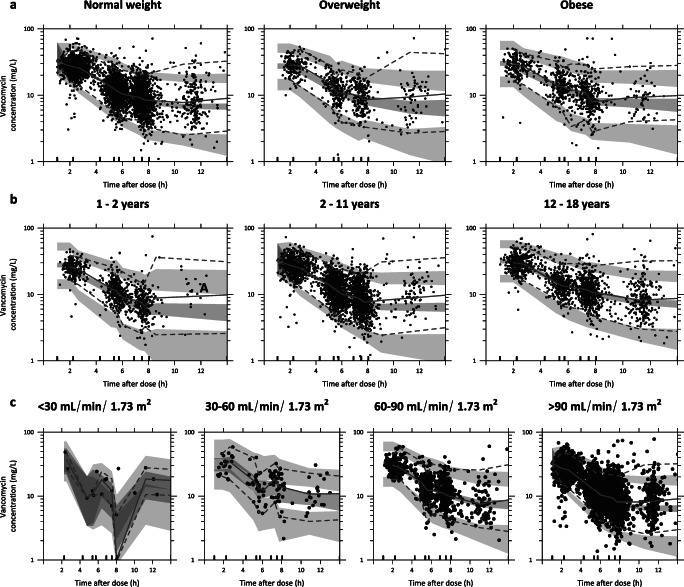
Fig. 3.
Prediction and variability corrected visual predictive check (pvcVPC), split for a weight group, b age group, and c for renal function group based on bedside Schwartz. Prediction-corrected observations are shown as dots, with the median, 2.5th and 97.5th percentiles shown as solid, lower, and upper dashed lines. Grey shaded areas represent the 95% confidence intervals of the median (dark grey) and 2.5th and 97.5th percentiles (light grey) of predicted concentrations (n = 500) based on the pharmacokinetic model. Intervals of the bins are shown by the vertical ticks on the bottom of the plot

