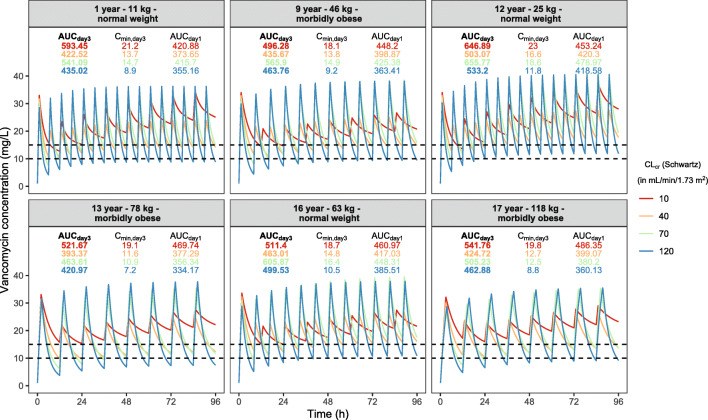
Fig. 4.
Vancomycin concentrations (mg/L) versus time (hours) in different typical individuals with body weight ranging 10–120 kg and renal function ranging 10–120 mL/min/1.73 m2 where vancomycin is dosed according to the proposed dosing guideline (Table III). For each individual, AUC (in bold), Cmin at day 3, and AUC at day 1 are shown in the graph (where color corresponds to the individual's renal function). Dashed lines represent the target concentrations for the trough concentrations (10–15 mg/L). AUC area under the curve, Cmin minimum (trough) concentration

