Fig. 1.
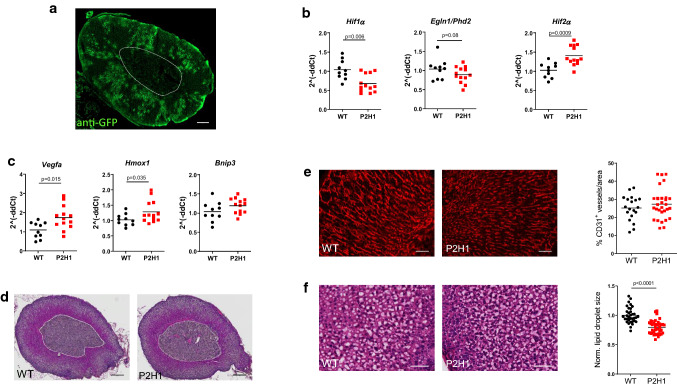
Characterization of the Akr1b7:cre-P2H1ff/ff mouse line with cortex-specific targeting of hypoxia pathway proteins. a Representative immunofluorescent image of anti-GFP stained (GFP +) area in the adrenal cortex of the Akr1b7:cre-mTmG mouse line. Region enclosed within the white dotted line represents the medulla and it demarcates the medulla from the cortex (scale bar, 100 μm). b qPCR-based mRNA expression analysis of Hif1α, Phd2 and Hif2α in entire adrenal tissue from P2H1 mice and WT littermates (n = 10–13). Relative gene expression was calculated using the 2^(−ddCt) method. The graphs represent data from 2 independent experiments. c Relative gene expression analysis using mRNA from the entire adrenal tissue in P2H1 mice and their WT counterparts (n = 10–13). All graphs represent data from 2 independent experiments. d Representative images (magnification 20x) of paraffin sections of adrenal glands (H&E) from 8-week-old WT and P2H1 mice (scale bars represent 100 μm). e Representative immunofluorescent images of CD31+ endothelial cell staining in adrenal gland sections from WT and P2H1 mice (scale bars represent 50 μm). Graph in the right-side panel represents quantification of CD31+ area as a fraction of total tissue area. Each data point represents a single measurement of the cortical area in the adrenal gland (collection of n= 6 vs 11 individual mice). f Representative images of cryosections of WT and P2H1 adrenal glands (H&E) (scale bars represent 50 μm). Graph in the right-side panel represents the normalized average size of an individual lipid droplet per section of adrenal gland tissue in WT versus P2H1 mice. Measurements were made from 6 sections per mouse. (n = 8 individual adrenals per genotype). The graphs in e and f are representative of 2 independent experiments

