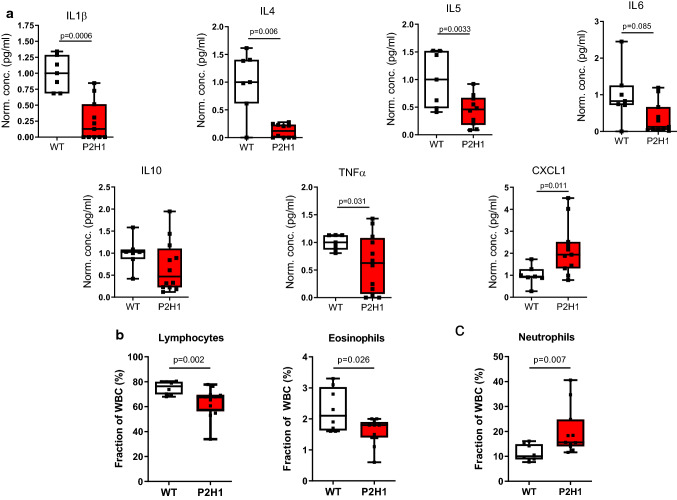
Fig. 4.
Immune system changes in P2H1 mice. a Box and whisker plots representing levels of pro/anti-inflammatory cytokines measured in the plasma of P2H1 mice and WT littermate controls (n = 7–12). All data were normalized to the average value seen in WT mice. Each dot represents data from one animal. b Box and whisker plots showing percentage lymphocytes and eosinophils in circulation which revealed reduced fractions in P2H1 mice compared to WT controls. c Greater numbers of circulating neutrophils in P2H1 mice compared to WT littermates. All graphs represent pooled results of 2 independent experiments

