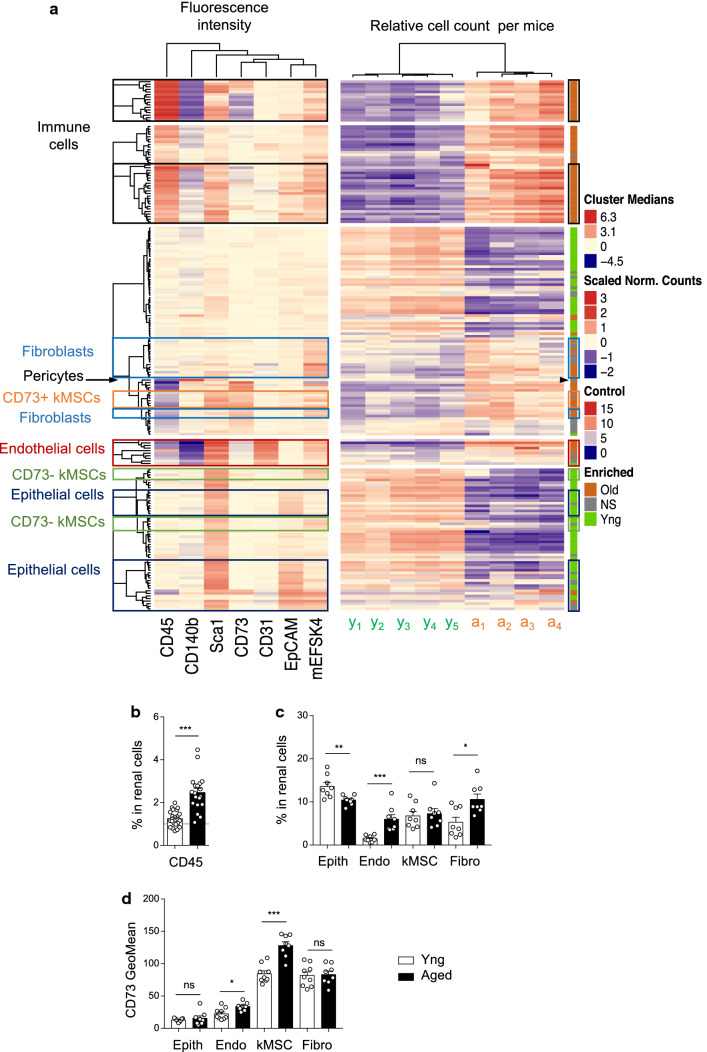
Fig. 2.
DECyt analysis reveals major changes in renal stromal cell subpopulations with aging. a Heatmap representation of renal cell clusters from young and aged mice by DECyt analysis, (left) Median fluorescence intensities of surface markers per clusters of renal cells, (middle) Relative count per cluster of young (y1–y5, n = 5 mice) or aged (a1–a4, n = 4 mice) renal cells. (Right) Clusters significantly enriched in young (green) or aged (orange) cells, P ≤ 0.01 by DESeq2. Not-significant (NS, grey). Hierarchical clustering identified clusters of immune cells (CD45+), endothelial cells (Endo, CD31+), tubular epithelial cells (Epith, EpCAM+), pericytes (CD140b+), fibroblasts (Fibro, Sca-1− mEFSK4+), mesenchymal stromal cells (kMSCs, Sca-1 + mEFSK4 +). b, c Percentage of (b) immune cells (young, n = 23; aged n = 19) (c) Epith, Endo, kMSC and Fibro (young, n = 8; aged n = 8) in renal cells by flow cytometry. d Fluorescence geometric mean of CD73 in the indicated renal cell populations (Epith, Endo, kMSC, Fibro) of young (n = 9) or aged (n = 8) mice. *P < 0.05 ***P < 0.001 ns, not significant, with Mann–Whitney’s U test

