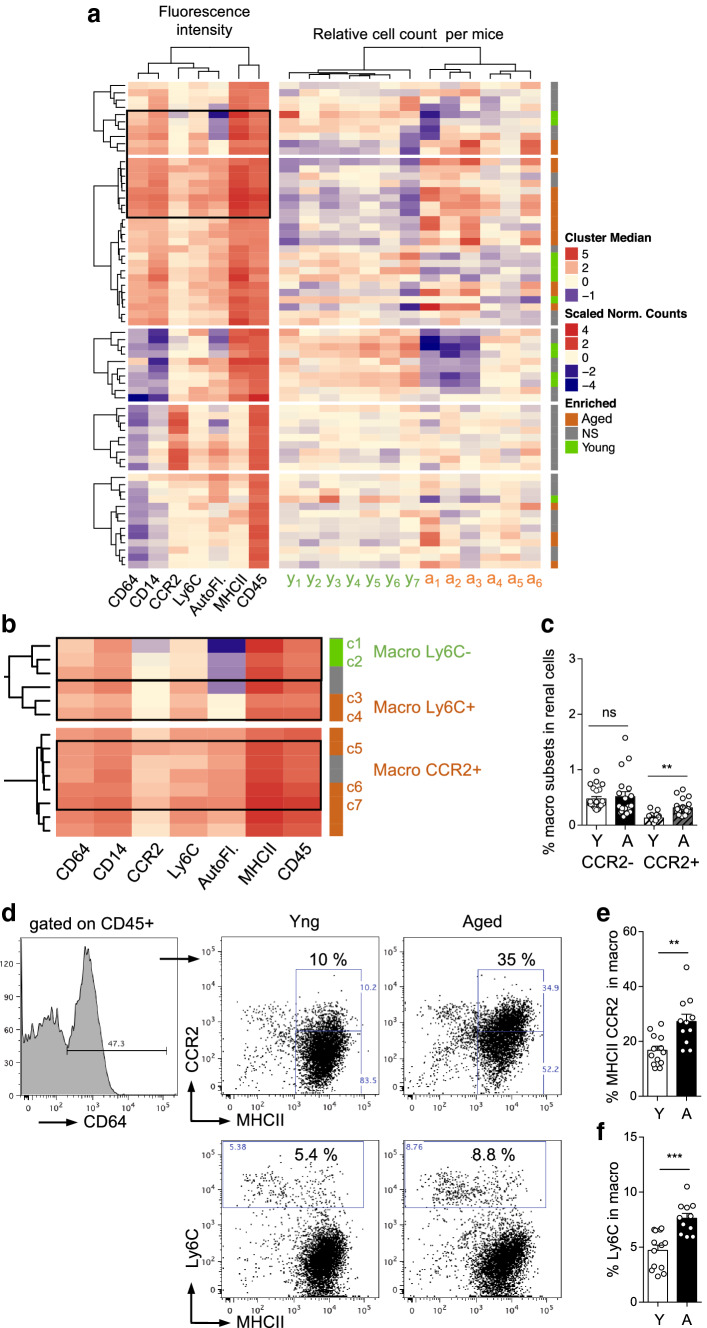
Fig. 4.
DECyt analysis and phenotypic characterization of renal macrophage subsets modified with aging. a, b Heatmap representation of CD45+ renal immune cell clusters from young and aged mice by DECyt analysis (a), (left) Median fluorescence intensities of surface markers and autofluorescence (AutoF.) per clusters of CD45+ renal immune cells (middle) Relative count per cluster of young (y1–y7, n = 7 mice) or aged (a1–a6, n = 6 mice) renal immune cells. (Right) Clusters significantly enriched in young (green) or aged (orange) cells, P ≤ 0.01 by DESeq2. Not-significant (NS, grey). b Enlargement of some macrophage clusters. c Percentage of CCR2− or CCR2+ macrophages in renal cells of young (n = 23) or aged (n = 19) mice (d–f) Representative dot-plots of MHCII and CCR2 or Ly6C expression by CD64+ macrophages (d), percentage of CCR2+ in CD64+ MHCIIhigh macrophages (e), percentage of Ly6C in CD64+ macrophages (f) of young (n = 13) or aged (n = 11) mice. **P < 0.01 ***P < 0.001, ns, not significant with Mann–Whitney t test

