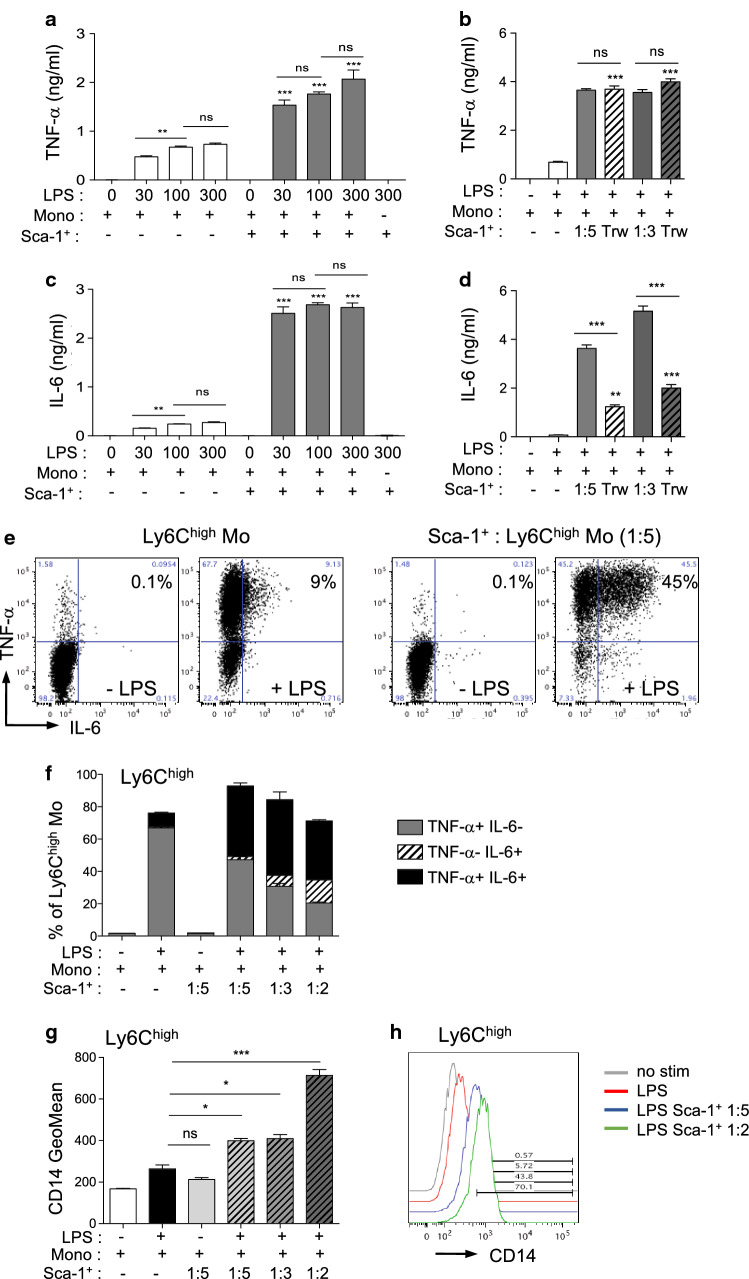
Fig. 6.
Monocyte/macrophage crosstalk with Sca-1+ renal cells modulates inflammatory responses. a–d TNF-α (a, b) and IL-6 (c, d) concentrations in co-culture supernatants of monocytes (mono) and Sca-1+ renal cells (Sca-1+) stimulated or not for 24 h with LPS (a, c) Co-cultures (ratio Sca-1+ : mono, 1:5) treated with increasing doses of LPS (0–300 ng/ml) and compared to monocytes or Sca-1+ alone. b, d Co-cultures of monocytes and Sca-1+ renal cells performed without or with transwells (Trw, Mo in the upper chamber) were stimulated for 24 h with 300 ng/ml LPS (ratio Sca-1 + : mono, 1:5 or 1:3) (n = 8). e, f Intracellular staining of IL-6 and TNF-α in Ly6Chigh CX3CR1low monocytes co-cultured or not with Sca-1+ renal cells and stimulated or not with 300 ng/ml LPS for 4 h. Representative dot plots (e) and histograms (f) showed percentages of IL-6 + and/or TNF-α + in monocytes for the different culture conditions (n = 8). g, h Fluorescence geometric mean (g) and representative histogram (h) of CD14 expressed by Ly6Chigh CX3CR1low monocytes co-cultured or not with Sca-1+ cells at different ratio (ratio Sca-1+ : mono, 1:5, 1:3 or 1:2) and stimulated or not with 300 ng/ml LPS for 4 h. **P < 0.01 ***P < 0.001 ns, not significant, unless indicated, groups are compared to LPS treated Mo alone, One-way ANOVA with Bonferroni’s post-test

