
Extended Data Fig. 4. Differentially regulated regions in EVC2.
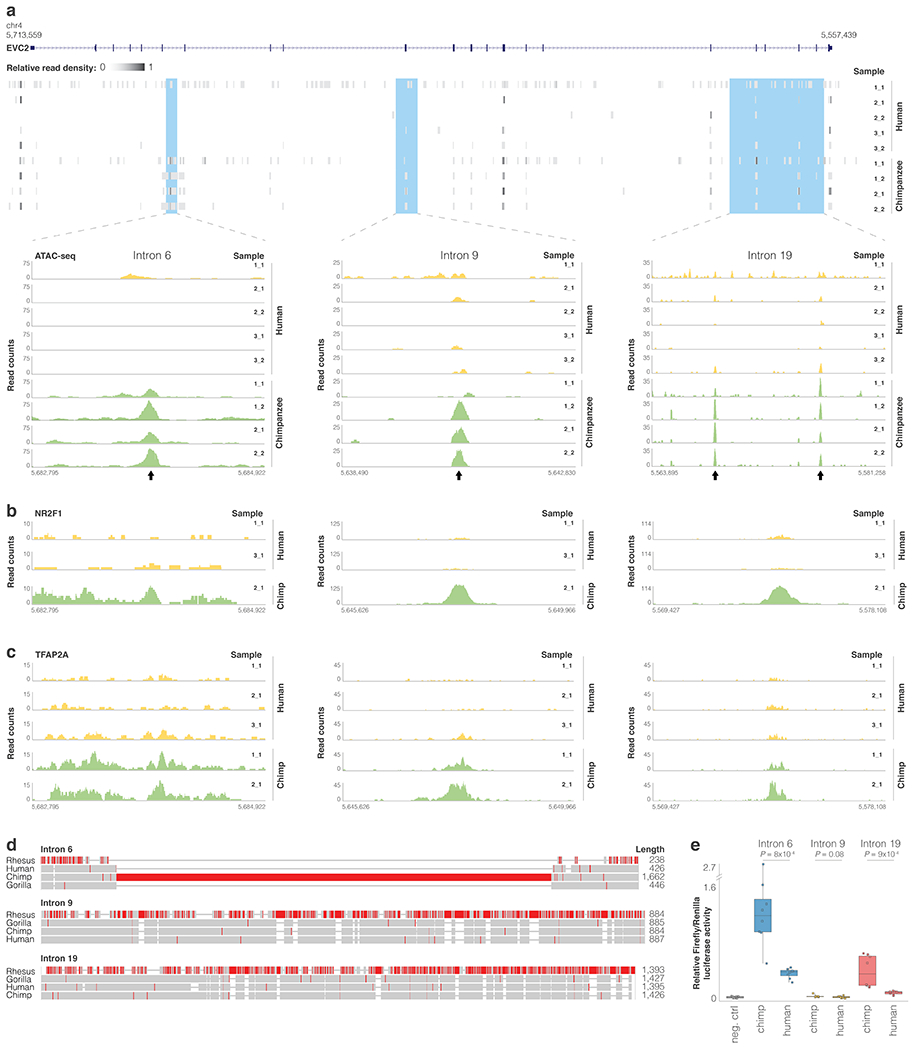
ATAC-seq read pileup along EVC2 and for the three loci showing species-biased peaks within EVC2. Arrows mark peaks. b,c. NR2F1 and TFAP2A ChIP-seq read pileup for loci <10 kb away from the ATAC-seq peaks. d. MUSCLE103 sequence alignment of rhesus, gorilla, chimp and human sequences. Regions with a high proportion of mismatches are colored in red. e. Reporter assay comparing relative firefly/Renilla luciferase activity for chimpanzee and human EVC2 sequences following transient transfection in human DPSCs. Empty vector (pGL4.11b) was used as negative control. Box plots show mean (center), 2nd and 3rd quartiles (box boundaries), and minima and maxima (whiskers). One-tailed t-test P-values in two independent experiments of quadruplet measurements (n = 8) are shown.