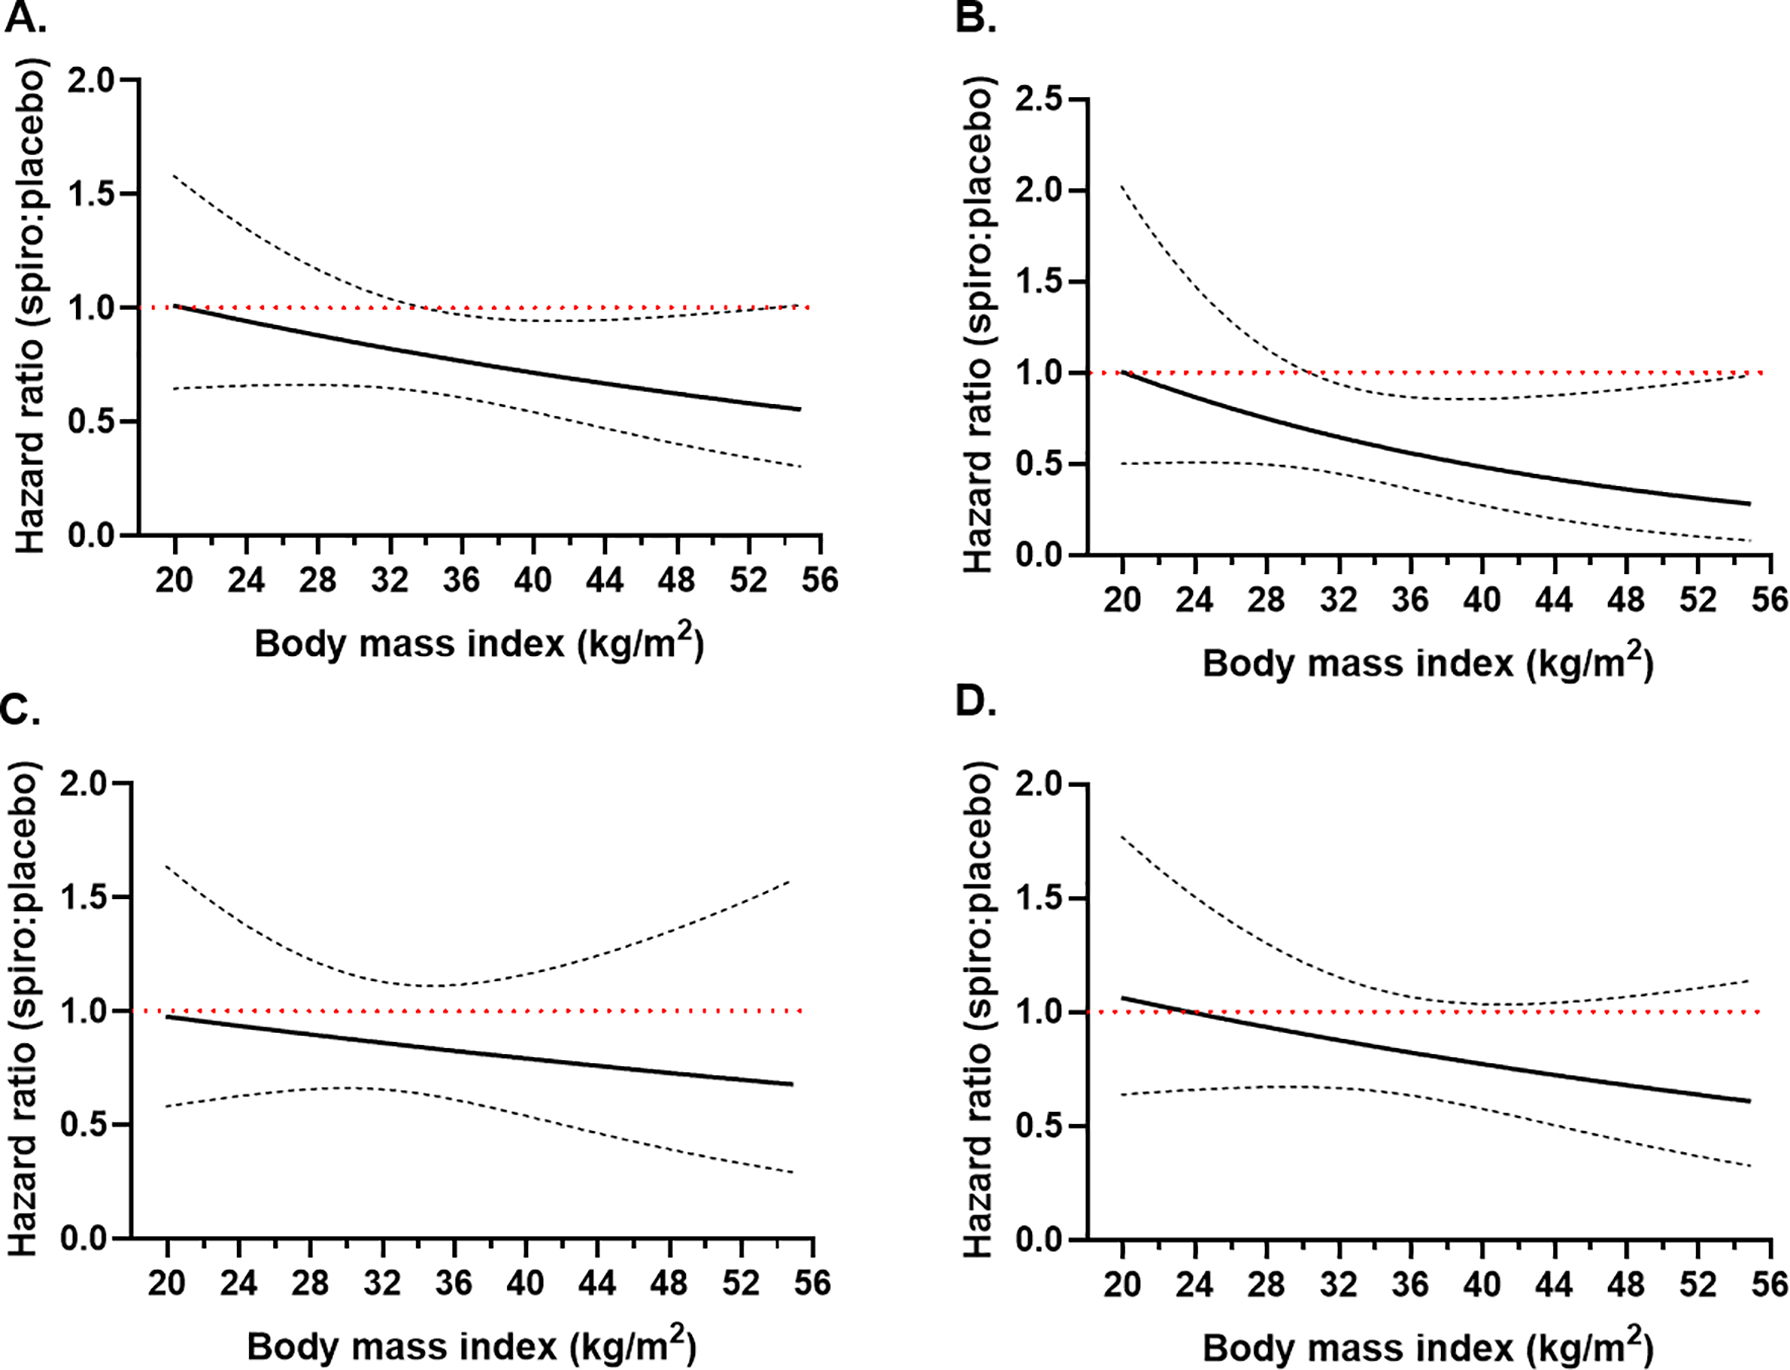
Figure 4.

Plot of the spironolactone effect vs. placebo as a function of continuous BMI in the adjusted model for the primary outcome (A), cardiovascular death (B), all-cause death (C) and heart failure hospitalizations (D). Dashed lines represent 95% confidence intervals of the hazard ratio. The red horizontal line depicts where the upper limit of the confidence intervals crosses 1, indicating a statistically significant effect.
