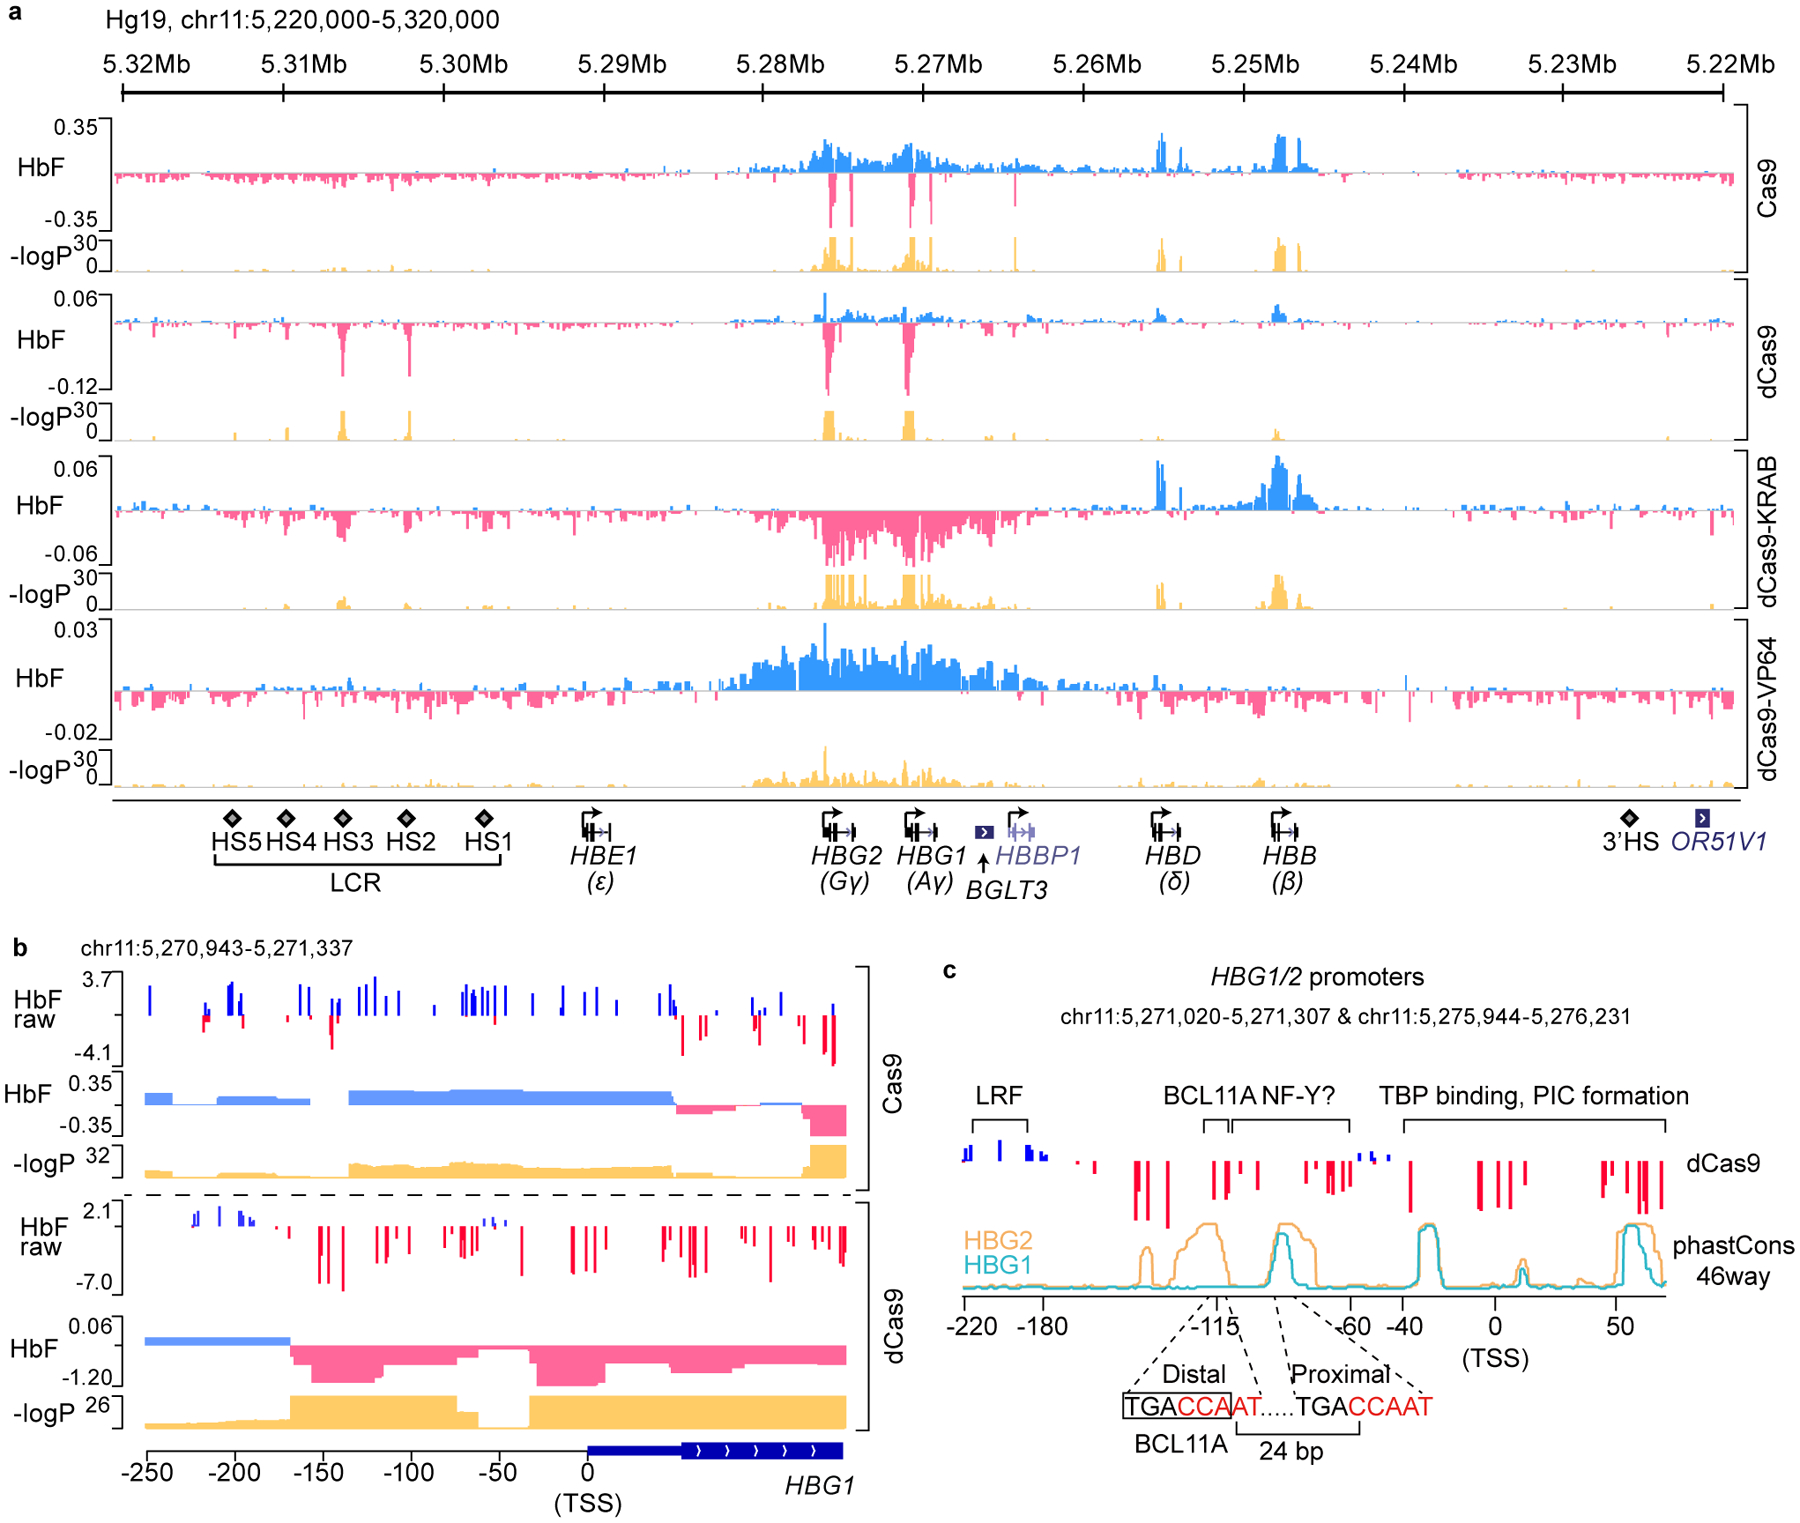
Figure 1. dCas9 dense perturbation reveals an activator element at the γ-globin promoters.

(a) Dense perturbation of genomic sequences around the β-globin gene cluster by pooled gRNA library in Cas9, dCas9, dCas9-KRAB or dCas9-VP64 expressing HUDEP-2 cells. gRNA enrichment in HbF-high cells was used to deconvolute underlying genomic regulatory signal (with “HbF” track displaying beta coefficient). Corresponding p-values are shown on −log10 scale.
(b) A zoomed-in view of the dense perturbation results at the γ-globin (HBG1) promoter and first exon. “HbF raw” scores were calculated as enrichment of reads for each sgRNA in HbF-high compared to the unsorted population at end of erythroid maturation (shown as log2 fold change). “HbF” track depicts the deconvoluted regulatory signal as beta coefficient with associated p-values below. Minor ticks indicate value of zero. The result at the HBG2 promoter was the same as the sequences share 99.3% identity.
(c) Schematic structure of γ-globin promoters. The binding sites of LRF/ZBTB7A, BCL11A, and TBP are indicated. Sequence conservation of HBG1 and HBG2 promoters across 46 vertebrates (phastCons46way) are shown as cyan and orange lines, respectively. Two CCAAT boxes that are potential binding sites of NF-Y are highlighted in red. The distal TGACCA motif through which BCL11A represses γ-globin expression is delineated with a rectangle.
Statistical tests of the beta coefficients were performed empirically through bootstrapping and two-tailed tests. Multiple hypothesis testing was accounted for with the Benjamini-Hochberg (BH) procedure.
