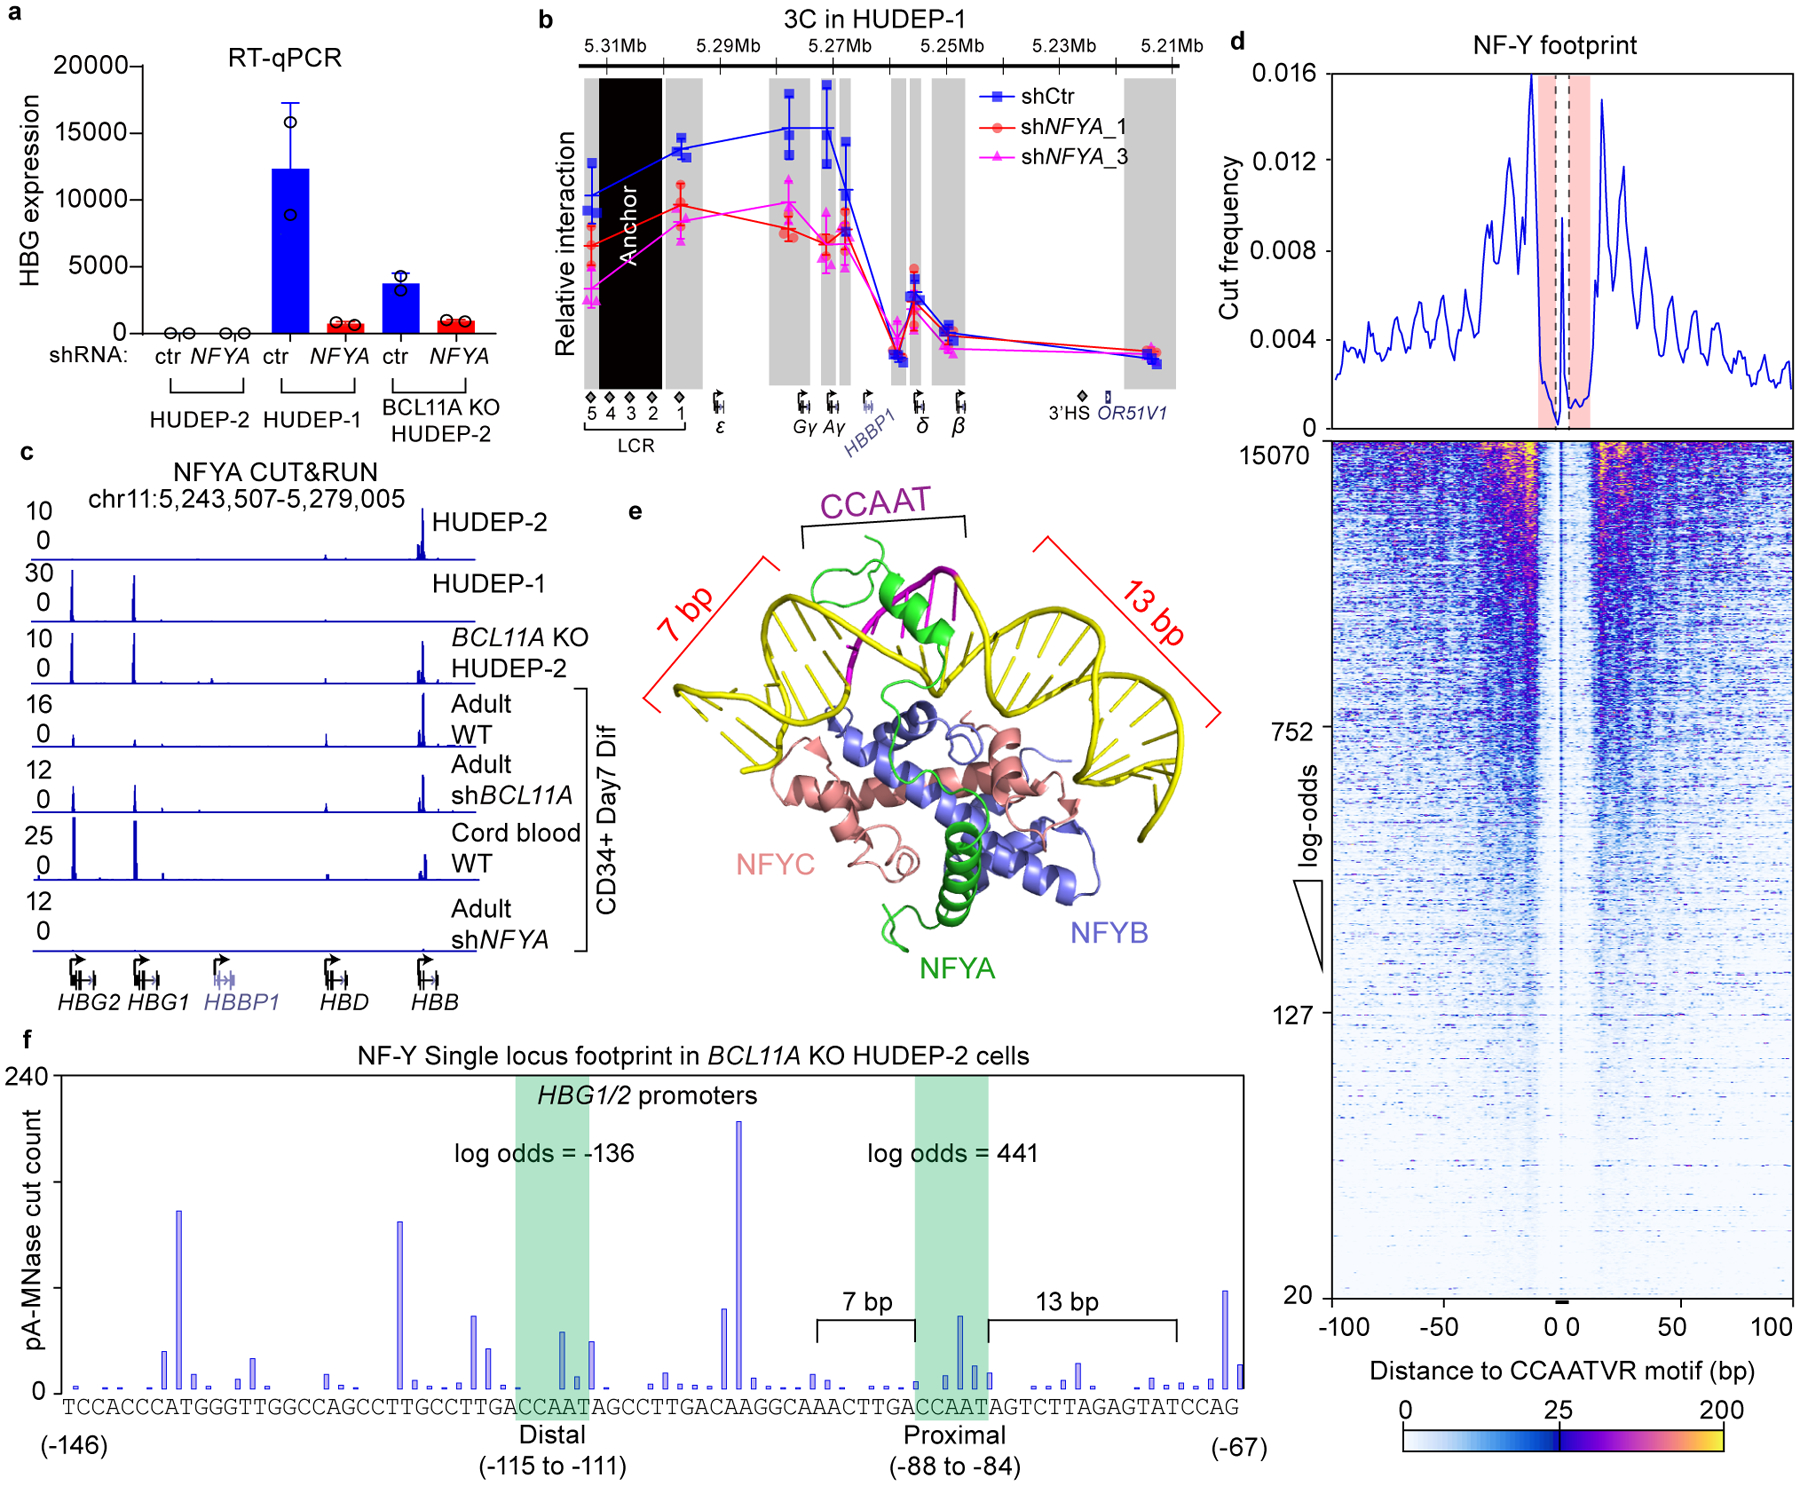
Figure 2. NF-Y activates γ-globin through direct binding to the proximal CCAAT.

(a) RT-qPCR analysis of γ-globin expression in HUDEP-2, HUDEP-1, BCL11A KO HUDEP-2 cells with and without NFYA knockdown. The result is shown as mean (SD) of two technical replicates and representative of two biological replicates. HPRT1 was used throughout as an endogenous control to normalize between samples.
(b) Chromosome Conformation Capture qPCR in HUDEP-1 cells with or without NFYA knockdown to evaluate LCR-globin interaction. EcoRI fragment encompassing HS2–4 of the LCR was used as anchor point. Each grey box indicates a restriction fragment. The result is shown as mean (SD) of three technical replicates.
(c) NFYA CUT&RUN in HUDEP-2, HUDEP-1, BCL11A KO HUDEP-2 cells and in primary human CD34+ cells derived erythroid cells (four lower tracks are: adult, adult with BCL11A knockdown, fetal, and adult with NFYA knockdown). CUT&RUN tracks in HUDEP cells are representatives of multiple biological replicates. CUT&RUN in CD34+ cells with CRISPR editing yielded similar results (see Figure 4).
(d) Motif footprint analysis of NFYA CUT&RUN. (Upper) Average cut probability of each base surrounding and within CCAATVR motifs was plotted. The core CCAAT motif lies within the dashed lines. Motif flanking regions (7 bp upstream and 11 bp downstream) are shaded red and were protected from nuclease digestion. (Lower) Heat map of NF-Y footprints at all the NF-Y peaks with a log-odds higher than 20. Each row represents one NF-Y binding site, ranked by log-odds value. Color key is shown at the bottom.
(e) Structure of NF-Y/DNA complex adapted from26 and generated with PyMOL. Note that DNA bending is induced by NF-Y binding and flanking sequences are wrapped around NF-Y through histone-fold domains of NFYB and NFYC. NFYA is responsible for motif recognition.
(f) Single locus cut profile at the γ-globin promoters, generated using NFYA CUT&RUN in BCL11A KO HUDEP-2 cells. The proximal CCAAT motif but not the distal one revealed a footprint of NF-Y. The log-odds of NF-Y binding are labeled.
