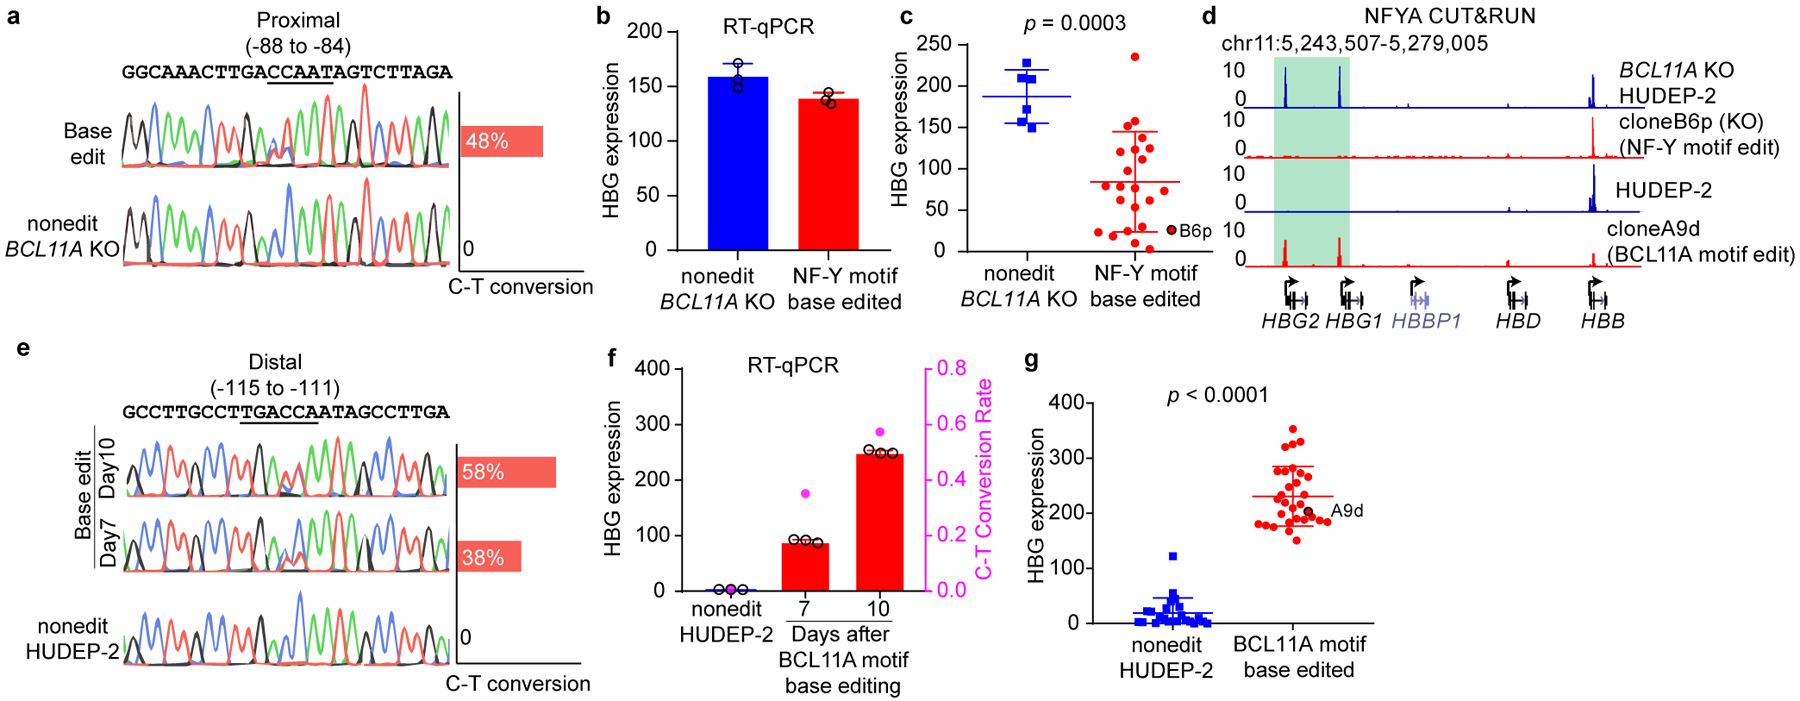
Figure 3. Base editing of the NF-Y motif reduces γ-globin expression.

(a) Sanger sequencing confirmed base editing of the NF-Y motif in the γ-globin promoters. Quantification of editing efficiency is shown as bar graph on the right. The editing is performed in BCL11A KO HUDEP-2 cells.
(b) RT-qPCR showing the γ-globin expression level in bulk cells after NF-Y motif editing. The result is shown as mean (SD) of three technical replicates.
(c) RT-qPCR analysis of γ-globin expression in multiple independent clones derived from NF-Y motif base editing. Data is showed as mean (SD) of multiple independent clones. Nonedit: n=6, base edited: n=27. Two-tailed, unpaired t-test, t=4.010, df=32. Clone B6p (circled) was used for CUT&RUN analysis in Figure 3d.
(d) NFYA CUT&RUN in BCL11A KO HUDEP-2, NF-Y motif edit clone B6p (in BCL11A KO background), HUDEP-2, and BCL11A motif edit clone A9d (wild-type background).
(e) Sanger sequencing confirmed base editing of the BCL11A motif in the γ-globin promoters. Quantification of editing frequency is shown as bar graph on the right. The editing is performed in wild-type HUDEP-2 cells.
(f) RT-qPCR showing the γ-globin expression level in bulk cells after BCL11A motif editing. Cells collected at different time points showed different degrees of editing. The result is shown as mean (SD) of three technical replicates. C-T conversion rates are shown as the right y-axis.
(g) RT-qPCR analysis of γ-globin expression in multiple independent clones derived from BCL11A motif base editing. Data is showed as mean (SD) of multiple independent clones. Nonedit: n=23, base edited: n=30. Two-tailed, unpaired t-test, t=17.11, df=51. Clone A9d (circled) was used for CUT&RUN analysis in Figure 3d.
