
Extended Data Fig. 4. Motif enrichment analysis.
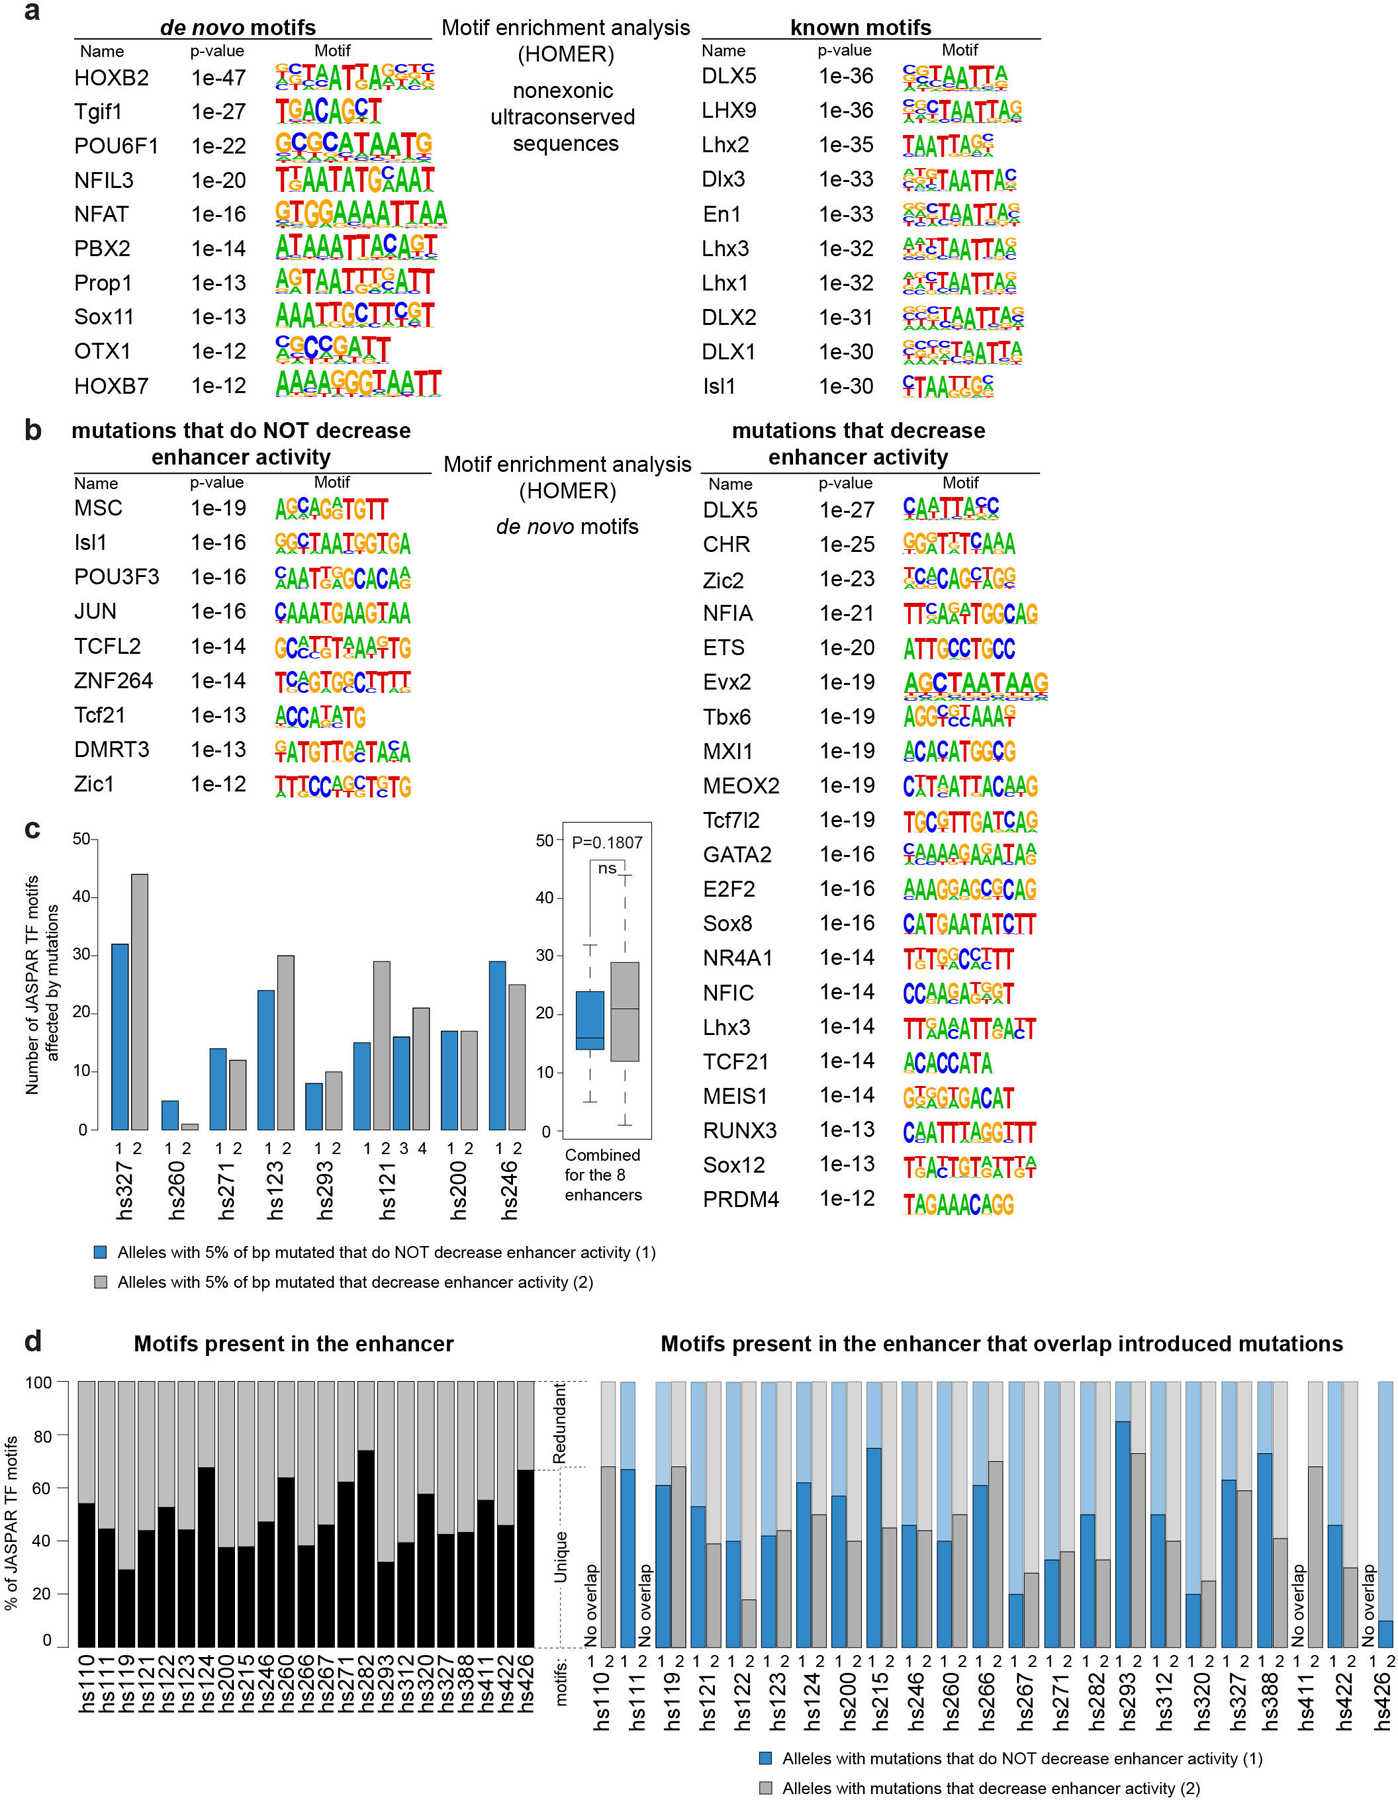
a, Motifs that are significantly enriched in 370 noncoding ultraconserved sequences compared to the whole human genome. b, Motifs that are significantly enriched in 15 base pair k-mers centered on introduced mutations compared to the whole human genome. c, Left: Bar plot comparing the number of transcription factor motifs in the JASPAR database that overlap introduced mutations in alleles of the same enhancer that either decreased enhancer activity (grey bars) or not (blue bars). Each allele has 5% of ultraconserved base pairs mutated. Right: Boxplot summarizing data from all eight enhancers shown in the bar plot. Data is presented as median in the center, first (25th percentile) and third (75th percentile) quartile as bounds of the boxes, and ± 1.5 × ICR (interquartile range = third − first quartile) from bounds of the boxes as whiskers. d, Left: Bar plot showing the percentage of JASPAR transcription factor motifs overlapping 23 enhancers mutated in this study that occur in the ultraconserved sequence of an enhancer only once (unique, black) or multiple times (redundant, grey). On average, 48% of motifs were unique. Right: Bar plot comparing distribution of unique vs. redundant transcription factor motifs that overlap introduced mutations between mutant alleles that saw decrease in enhancer activity (grey bars) and those that did not (blue bars). On average, ~52% of motifs that overlapped introduced mutations that did not decrease enhancer activity were unique, while the average for unique motifs that overlapped introduced mutations that decreased enhancer activity was ~44%.