Fig. 1.
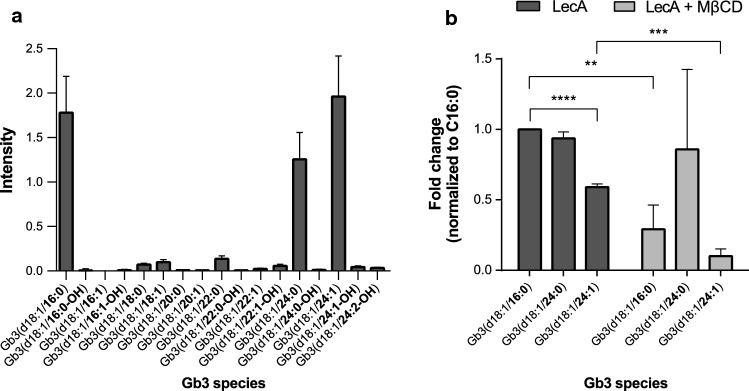
Lipid analysis by LC–MS reveals a preference of LecA for saturated Gb3 species. a Distribution of Gb3 species in H1299 cells. Most dominantly present Gb3 species were Gb3(d18:1/16:0), Gb3(d18:1/24:0) and Gb3(d18:1/24:1). Intensities were normalized to an internal standard. b Pulled-down Gb3 species [normalized to internal standard, input values and Gb3(d18:1/16:0)] by LecA-biotin demonstrated a preference for saturated over unsaturated Gb3 species. Significantly less Gb3(d18:1/16:0) and Gb3(d18:1/24:1) was pulled-down in MβCD-treated cells stimulated with LecA-biotin. The Gb3 species Gb3(d18:1/24:0) seemed less affected by the treatment. Still, the unsaturated species Gb3(d18:1/24:1) was least preferred. For clarity, only the three dominantly present species Gb3(d18:1/16:0), Gb3(d18:1/24:0) and Gb3(d18:1/24:1) are depicted. For all panels: bars display mean values of three biological replicates, error bars represent SD, **p < 0.01, ***p < 0.001, ****p < 0.0001 (one-way ANOVA and Dunnett’s multiple comparisons test)

