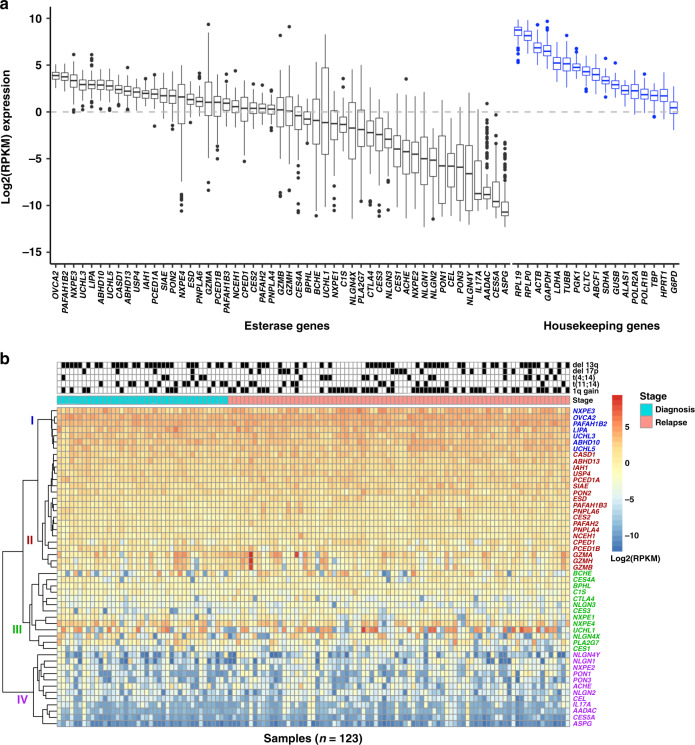
Fig. 1. Esterase gene expression profile in multiple myeloma samples from the in-house FIMM dataset.
a Log2(RPKM) expression of esterases and housekeeping genes, ranked based on median expression values.a b Esterase expression heatmap and hierarchical clustering based on expression levelb. FIMM Institute for Molecular Medicine Finland, MM multiple myeloma, RPKM reads per kilobase of transcript per million mapped reads. n = 123 samples; genes with log2(RPKM) > 0 were considered as expressed. aBox plots: thick central line represents median; top and bottom lines of box represent third quartile and first quartile; whiskers indicate the variability in the data outside the upper and lower quartile; filled black circles represent outliers. bThe unsupervised hierarchical clustering of esterase gene expression profiles was performed using method complete-linkage and Manhattan distance measures.

