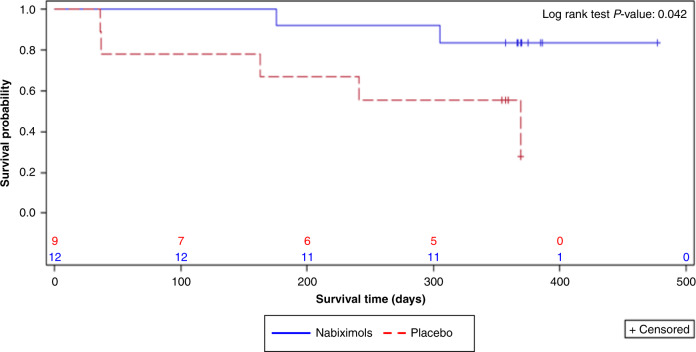
Fig. 3. Kaplan–Meier survival curves (randomised safety analysis set).
Patients who did not die during the 1-year analysis period were censored and marked by a +. If a patient was alive at the end of treatment, then the end of treatment visit was the date at which they were censored. Otherwise if a patient withdrew, they were censored at the date of the survival status review. If a patient was lost to follow-up then they were censored at the last known visit date. The number of patients at risk at a given timepoint was the number still alive or who had not been censored.

