
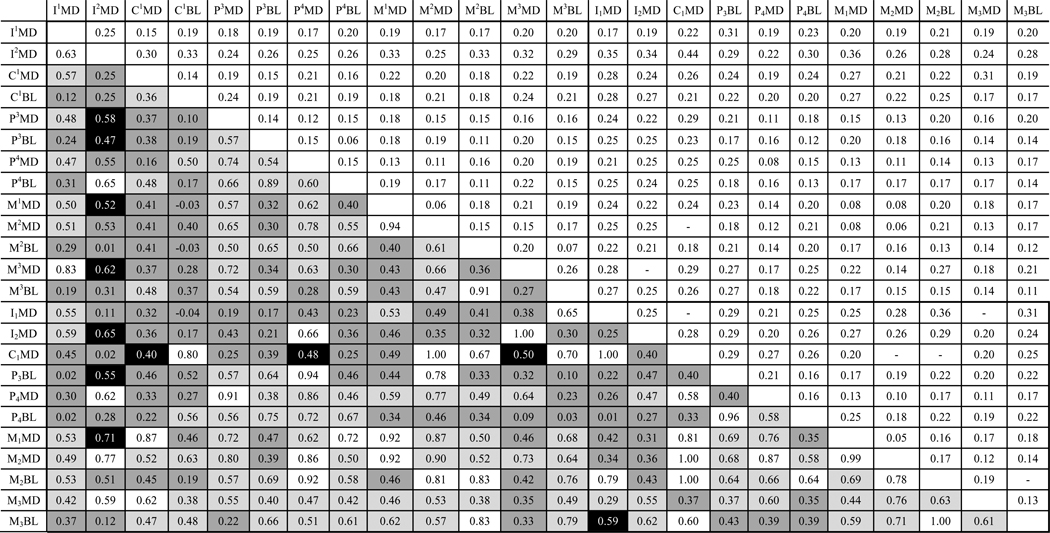
Table 4.
Results of genetic correlation estimation. Left of diagonal cells contain genetic correlation estimates, right of diagonal cells contain corresponding standard error estimates.a–b
|
a
White, significantly different (p < 0.05) from zero but not from one; pale grey, significantly different from zero and from one (p < 0.05); dark grey, not significantly different from zero (p > 0.05); black, not significantly different from zero or one (p > 0.05).
b
SE could not be estimated for genetic correlations equal to 1.00.