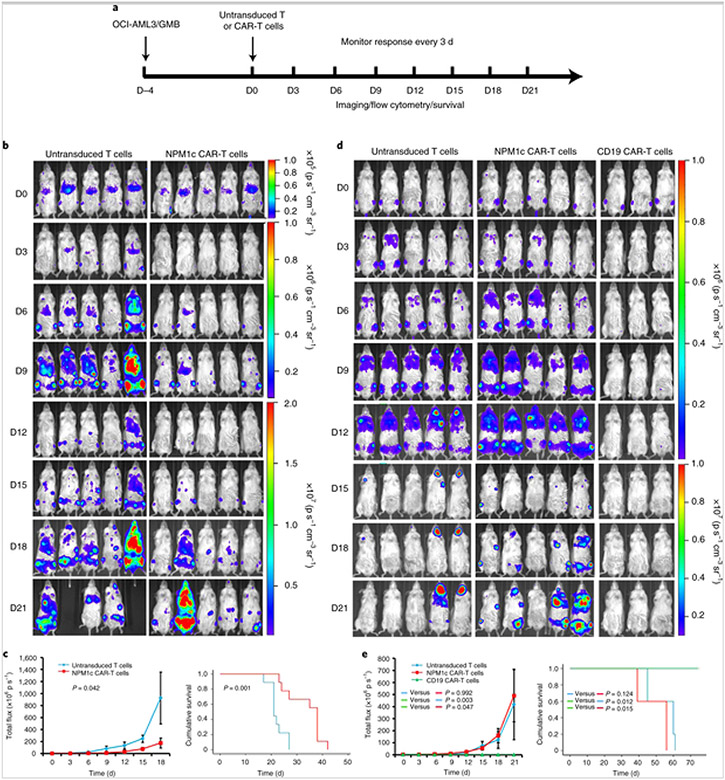
Fig. 5. NPM1c CAR-T cell therapy reduces leukaemia burden and prolongs survival.
a, Schematic of the experimental process. NSG mice were injected with OCI-AML3 cells (1 × 10⁶) or GMB cells (2 × 10⁶) intravenously (D–4) and imaged for engraftment 4 d later (D0). Mice were then injected intravenously with 1 × 10⁷ NPM1c CAR-T cells, untransduced T cells or CD19 CAR-T cells. The mice were monitored by BLI every 3 d to assess tumour burden and survival. b, Comparison of the OCI-AML3 leukaemia burden by BLI between mice treated with NPM1c CAR-T cells and untransduced T cells at the indicated days (D0–D21) post-T cell injection (n = 5). The scales for imaging are shown to the right. The experiment was repeated twice, with four and five mice per group. c, Comparison of the total flux (luciferase signals from systemic OCI-AML3 leukaemia cells) in the mice (n = 5) from b (left), and Kaplan–Meier survival curves (right; n = 9) of mice treated with either NPM1c CAR-T cells or untransduced T cells. d, Comparison of GMB lymphoma burden by BLI between mice treated with NPM1c CAR-T cells (n = 5), untransduced T cells (n = 5) and CD19 CAR-T cells (n = 3) at the indicated days (D0–D21) post-T cell injection. The scales for imaging are shown to the right. The experiment was repeated twice with five mice for the untransduced T cells and NPM1c CAR-T cells groups and three mice for the CD19 CAR-T cells group. e, Comparison of the total flux (luciferase signals from systemic GMB cells; left) and Kaplan–Meier survival curves (right) of mice treated with either NPM1c CAR-T cells (n = 5), untransduced T cells (n = 5) or CD19 CAR-T cells (n = 3). The graphs for total flux were created using Microsoft Office 2016 and the survival curve graphs were created using SPSS Statistics 22 software. Data points and error bars represent means ± s.e. P values (two-way repeated-measures analysis of variance for total flux and two-sided Mantel–Cox log-rank test for survival comparison) are indicated. Note that in b different scales are used for day 0, days 3–9 and days 12–21, and in d different scales are used for days 0–12 and days 15–21, for better comparison among the mice at different days post-treatment.

