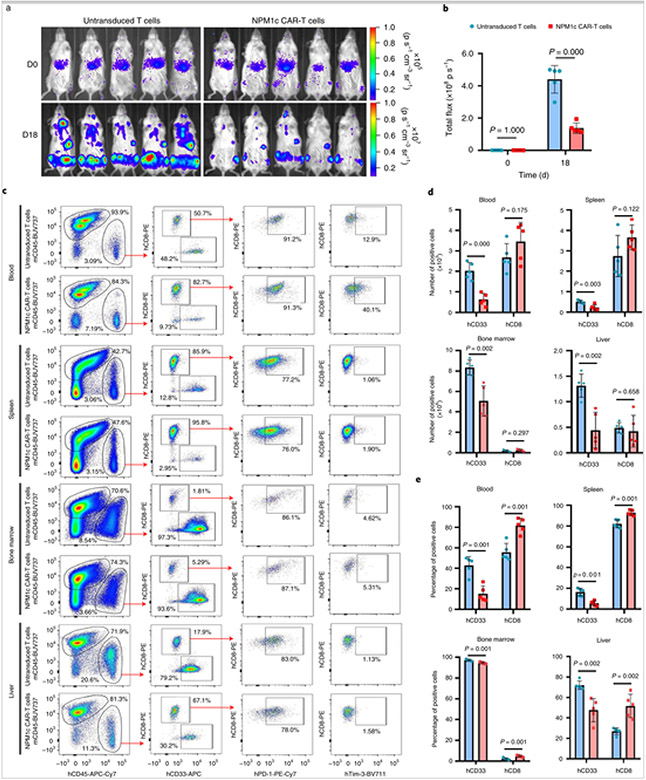
Fig. 6. NPM1c CAR-T cells reduce the leukaemia burden in blood, spleen, bone marrow and liver.
a,b, NSG mice were injected with OCI-AML3 AML cells and then either untransduced T cells or NPM1c CAR-T cells, as in Fig. 5a. Mice (n = 5) were imaged on the day of T cell injection (day 0) and 18 d later. Shown are BLI images (a) and total flux (b). c, Representative flow cytometry plots showing the gating strategy and expression profiles. Blood, spleen, bone marrow and liver were harvested on day 18 and single-cell suspensions were prepared and stained for mCD45, hCD45, CD8, CD33, PD-1 and Tim-3, followed by flow cytometry. Shown are representative staining profiles and gating strategies, including: mCD45 versus hCD45 gating on live cells (DAPI−); hCD33 versus hCD8 gating on hCD45+ cells; human PD-1 versus hCD8 gating on hCD8+ cells; and human Tim-3 versus hCD8 gating on hCD8+ cells. The numbers indicate the percentages of cells in the gated region. d, Comparison of total numbers of hCD33+ leukaemic cells and hCD8+ T cells in different tissues between mice given NPM1c CAR-T cells and those given untransduced T cells. e, Comparison of percentages of hCD33+ leukaemic cells and hCD8+ T cells among hCD45+ cells in different tissues between mice given NPM1c CAR-T cells and those given untransduced T cells. The blue bars in b, d and e represent treatment with untransduced T cells, whereas the pink bars represent treatment with CAR-T cells. The graphs were created using GraphPad Prism version 8.00 software. Bars heights and error bars represent means ± s.e. P values (two-sided independent-samples t-test) are indicated in b, d and e (n = 5).

