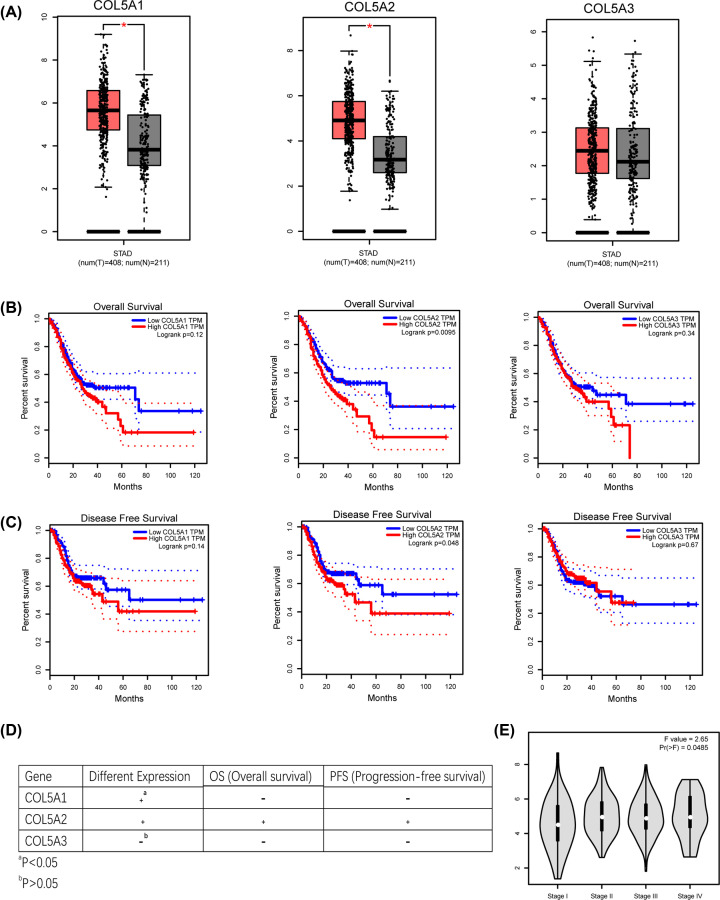
Figure 1. Expression and survival analysis of the COL5 family in the TCGA-STAD cohort.
(A) Box plot of the expression levels of the three genes in GC from the TCGA database. The x-axis shows the number of GC samples and normal samples, and the y-axis shows the gene expression levels. The P value was determined using Student’s t-test, and error bars were represented as means ± s.d. (B and C) Kaplan–Meier survival curves of the OS and PFS for three genes were plotted. The P value was determined using the log-rank test. (D) COL5A2 was found to be statistically significant in both expression and survival in patient samples, compared with COL5A1 and COL5A3. (E) Relationship between COL5A2 and T stage based on the TCGA-STAD data. P<0.05 represents statistical significance. *P<0.05

