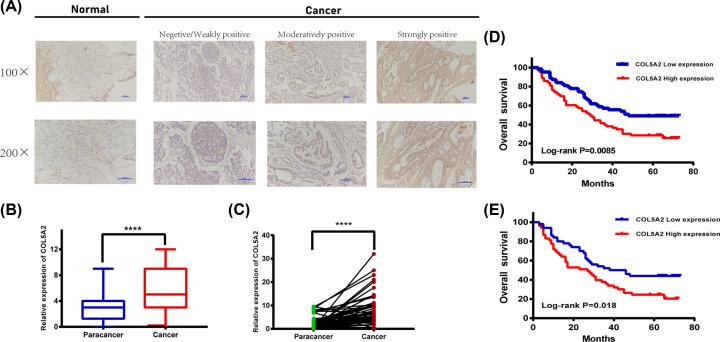
Figure 3. Detection of COL5A2 protein and mRNA expression in patient tissues.
(A) Representative images of COL5A2 protein expression in GC and normal tissues. IHC scoring based on the staining intensity was performed. The scale bar is displayed. (B) COL5A2 protein expression was significantly increased in primary tumor tissues (n=126), compared with that in adjacent normal tissues (n=60) by IHC. (C) RT-qPCR detected the COL5A2 mRNA level of the 48 paired fresh specimens and adjacent non-tumor tissues. (D) Kaplan–Meier analysis of COL5A2 in GC patients. Patients with low COL5A2 expression had longer OS than those with high COL5A2 expression (P=0.0085). (E) Kaplan–Meier analysis of COL5A2 in advanced GC patients (P=0.018). ****P<0.001. P<0.05 represents statistical significance.

