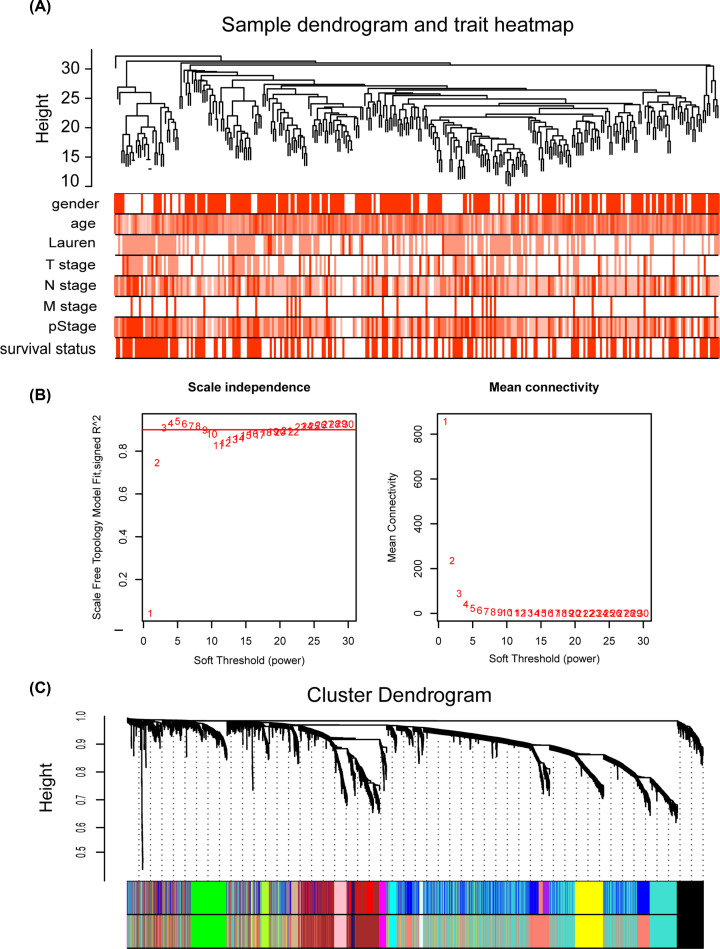
Figure 6. Construction of the weighted gene co-expression network.
(A) Clustering dendrogram of the clinical traits showed no obvious exception value. (B) Network topology analysis showed that when β = 3, the network topology met the threshold of 0.9 scale-free topology. The scale-free fit index in the left panel represents the soft-threshold power, and the mean connectivity in the right panels represents the soft-threshold power. (C) Clustering dendrogram of genes based on topological overlap. Each module served as a cluster of co-associated genes and was assigned a unique color.

