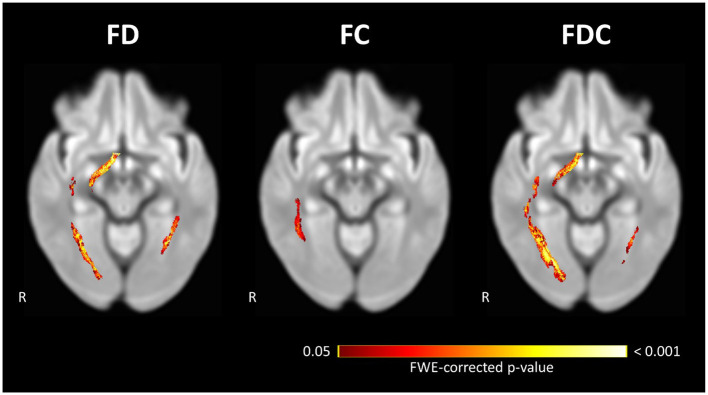
Figure 3.
Significant loss of FD, FC, and FDC in the visual pathways of POAG patients between Time-point 1 and Time-point 2. Repeated measures analysis of POAG patients reveals a significant loss of FD and FDC at the right OT and both ORs, and a significant loss of FC in the right OR. Streamlines corresponding to fixels exhibiting significant (FWE-corrected P < 0.05) loss are overlaid on a representative axial slice of the inter-subject population template and colored according to their p-values. Images are shown in radiologic convention. FC, fiber-bundle cross section; FD, fiber density; FDC, fiber density and bundle cross section.

