Figure 1.
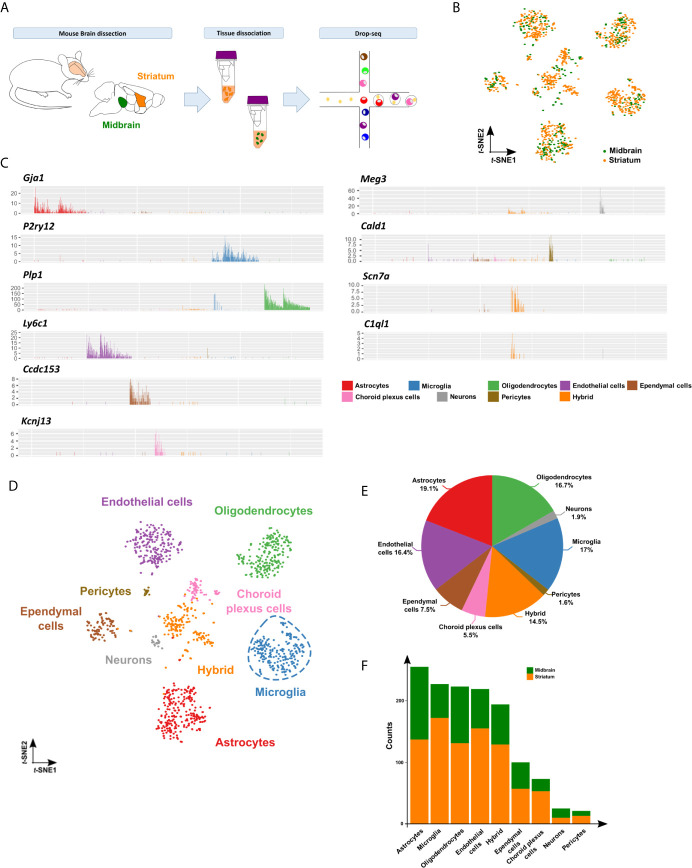
Single-cell transcriptomics identifies cellular diversity of the midbrain and striatum. (A) Schematic representation of the experimental approach. Tissue dissected and dissociated from midbrain (in green) and striatum (in orange) of six months-old C57BL/6J mice (pool of 5 mice) analyzed by Drop-seq. (B) t-SNE projection of 1,337 single cells included in the study showing 480 cells isolated from midbrain (in green) and 857 cells from striatum (in orange). (C) Bar plots of representative cell type-specific markers across nine identified clusters: microglia (P2ry12), astrocytes (Gja1), oligodendrocytes (Plp1), endothelial cells (Ly6c1), hybrid (Scn7a and C1ql1), ependymal cells (Ccdc153), choroid plexus cells (Kcnj13), neurons/neuronal stem cells (Meg3 and Snhg11) and pericytes (Cald1, Vtn, Notch3) clusters. See Figure S1 and Table S1 for additional cell type-specific markers used for cluster annotation. (D) Annotated clusters in the t-SNE map showing nine specific groups identified by differential expression analysis featuring 15,446 total genes (FDR<0.05): microglia (in blue), astrocytes (in red), oligodendrocytes (in green), endothelial cells (in purple), hybrid (orange), ependymal cells (brown), choroid plexus cells (in pink), neurons/neuronal stem cells (in grey) and pericytes (in pale brown). (E) Pie chart depicting the percentage of the identified cell types. (F) Bar plot showing proportion of cell types within midbrain (in green) and striatum (in orange).

