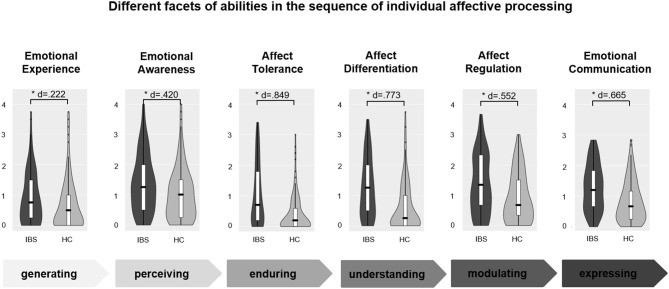
Figure 1.
Differences in dimensions of affective processing in IBS. The figure illustrates the whole spectrum of affective processing from generating, perceiving, tolerating, understanding, modulating, and expressing of affects. All items had an answering format of 0–4 (mean value of subscales on y-axis). Higher values reflect higher deficits in affective processing. The violin plots illustrate the distribution of the data by plotting the density (violin shaped mantle) including box plots with quartiles (white box), mean values (black line), and outliers (individual data points), separated for patients with irritable bowel syndrome (IBS) and healthy controls (HC). All group differences were significant (*), Cohens d effect sizes show the amount of the effect.

