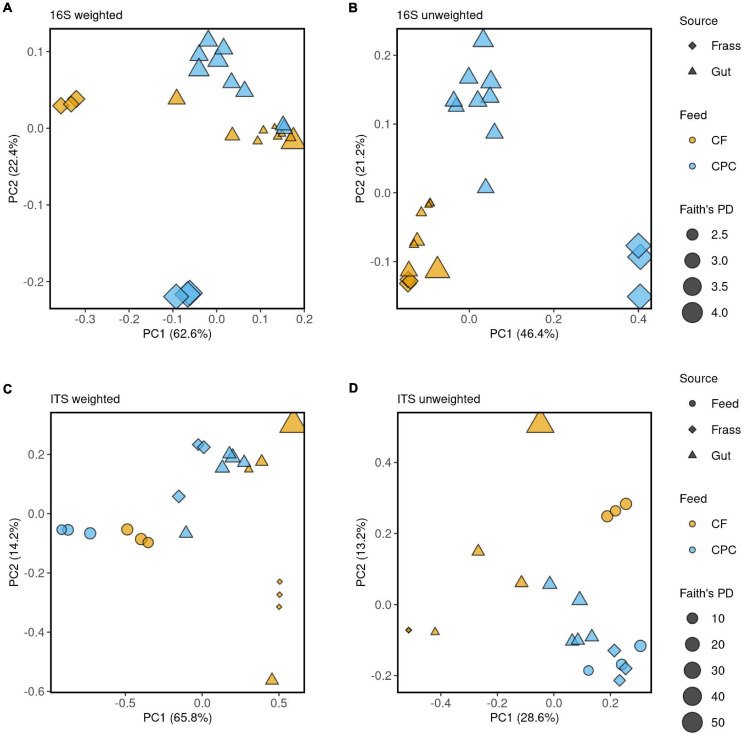
FIGURE 4.
Principal coordinates analysis (PCoA) of the microbial community structure among chicken feed (CF) and cottonseed press cake (CPC), BSFL guts and BSFL frass samples. (A,B) PCoA of bacterial communities calculated on weighted and unweighted UniFrac distance metrics, respectively. (C,D) PCoA of fungal communities calculated on weighted and unweighted UniFrac distance metrics, respectively. The 16S rRNA and ITS data were rarefied to an equal sequencing depth 5,484 and 2,639, respectively. The source of the sample is indicated by symbols color coded by feed source (CF and CPC), as displayed in the legend on the right side of the figure. Faith’s phylogenetic diversity (PD) is indicated by the size of the symbol.

