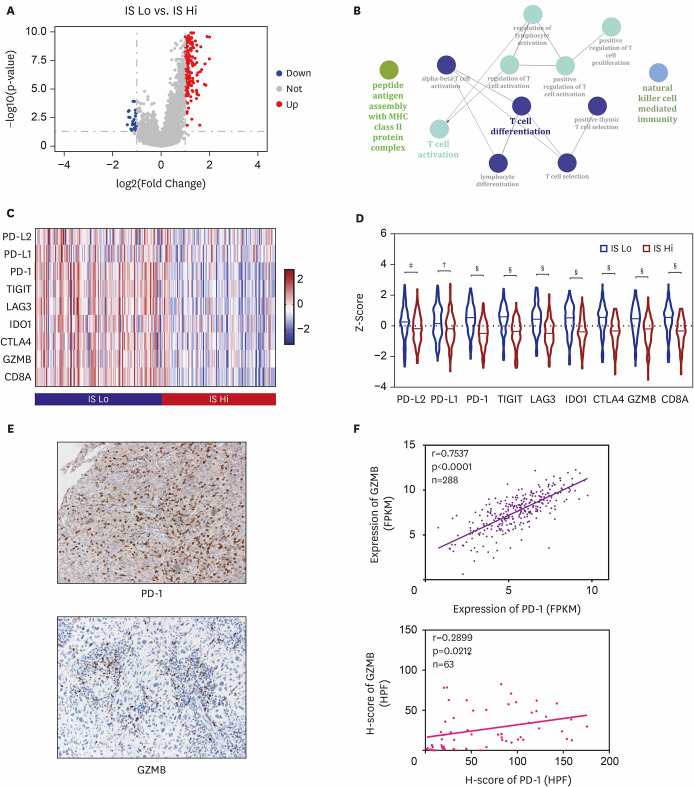
Fig. 4. Tissues with lower immune cell infiltrating score indicates a distinct immunobiology. (A) Volcano plot exhibited DEGs between IS Lo and IS Hi (red: up-regulated, blue: down-regulated, grey: no significance). (B) Network plot of immune system process that was up-regulated in IS Lo. (C) Heatmap of 7 ICPs and 2 effectors profiles. (D) Violin plots of ICPs and effectors between the 2 groups. (E) Images of IHC for PD-1, GZMB in TMA. (F) Correlations between PD-1 and GZMB in Cohort 1 and 2, respectively.
DEG, differentially expressed gene; HPF, high-power fields; ICP, immune checkpoint; IHC, immunohistochemistry; IS, immunoscore; TMA, tissue microarray.
*p<0.01; †p<0.001; ‡p<0.0001.

