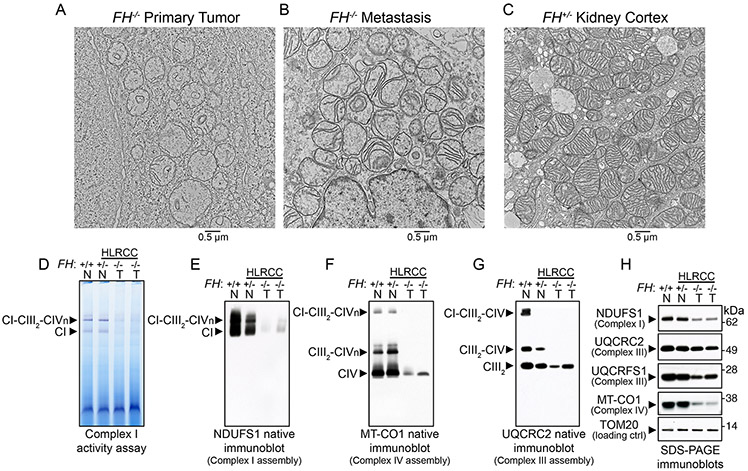
Figure 2. FH-deficient tumors exhibited altered mitochondrial ultrastructure and respiratory chain dysfunction.
(A-C) Electron microscopy of HLRCC primary tumor (A, FH−/−), metastasis (B, FH−/−), and non-tumor renal cortex from HLRCC patients (C, FH+/−). A total of 10 tissue specimens were obtained from three patients. 100-500 cells per specimen grid were evaluated before representative images were obtained. (D) In-gel assay of NADH dehydrogenase activity of Complex I (CI) in mitochondrial lysates from primary HLRCC tumors and renal cortex samples. (E) Native immunoblot (IB) for the nuclear-encoded Complex I subunit NDUFS1 in normal renal cortical and HLRCC tumor mitochondria (T, FH−/−). (F) Native IB for the mitochondrial-encoded Complex IV (CIV) subunit MT-CO1 in normal renal cortical and HLRCC tumor mitochondria to assess Complex IV levels and incorporation of Complex IV into supercomplexes containing Complex I, dimeric complex III (CIII2) and variable number of copies (from 1 to 4) of Complex IV (CIVn). (G) Native IB for the nuclear-encoded subunit of Complex III UQCRC2 in normal renal cortical and HLRCC tumor mitochondria to assess the assembly of Complex III-containing supercomplexes. (H) SDS-PAGE immunoblots for Complex I NDUFS1, Complex III UQCRC2 and Rieske protein UQCRFS1, and Complex IV MT-CO1 in normal renal cortical and tumor mitochondria. TOM20 served as the loading control for mitochondrial proteins. In (D) to (H), lane 1 consisted of renal cortex mitochondria from a non-HLRCC patient (FH+/+, N stands for normal), lane 2 was renal cortex mitochondria from HLRCC patient 10 (FH+/−, N stands for normal), and lanes 3 and 4 were primary tumor mitochondria from patients 4 and 3, respectively (FH−/− ,T stands for tumor).

