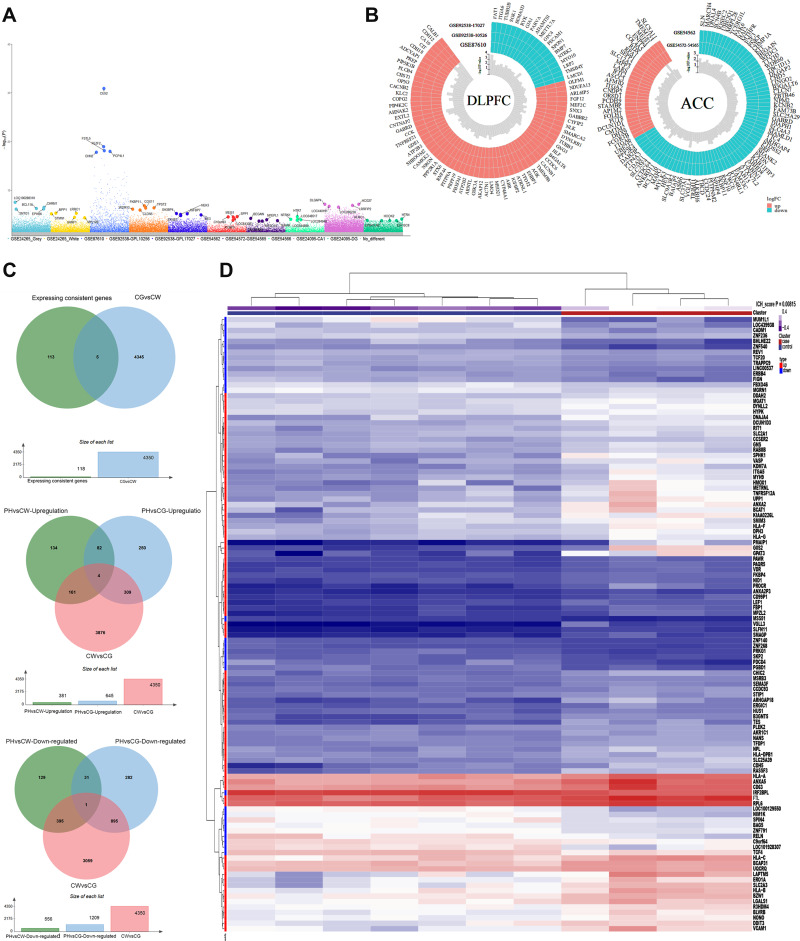
Figure 3.
Analysis of differentially expressed genes (DEGs) and their clustering. (A) DEGs of intracerebral hemorrhage (ICH) and depression tissue samples. The genes with the most significant expression differences in each dataset are labeled. (B) DEGs of ICH. (C) DEGs of ACC and DLPFC tissues from patients with depression. (D) Cluster analysis heatmap showing how the expression patterns of these DEGs can distinguish ICH from normal control tissues.
Abbreviations: ACC, anterior cingulate cortex; CG contralateral grey; CW, contralateral white; DLPFC, dorsolateral prefrontal cortex; PH, perihematomal tissue.

