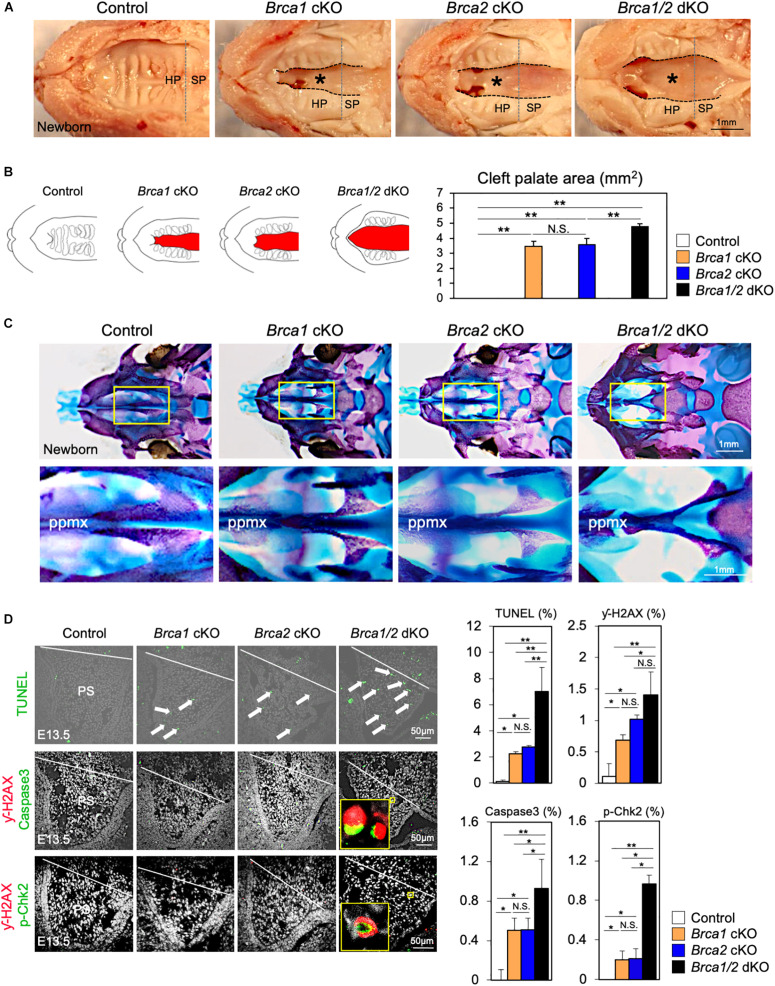
FIGURE 5.
Brca1 and Brca2 function synergistically during palatogenesis in mice. (A) Gross morphology of cleft palate (asterisks) in Brca1/2 mutants. HP, hard palate; SP, soft palate. (B) Schematic illustration of cleft palate (red) and the quantification of the palatal defective area among newborn control, Brca1 cKO, Brca2 cKO, and Brca1/2 dKO mice. (C) Skeletal analysis of palatal bones in Brca1/2 mutants. The lower panel shows the high-magnification images highlighted in the yellow boxes in the upper panel. ppmx, palatal process of maxilla. (D) TUNEL assay (green, upper panels) and corresponding quantification in palate sections from control, Brca1 cKO, Brca2 cKO and Brca1/2 dKO mice. Arrows show TUNEL-positive signals. Immunostaining for γ-H2AX (magenta, middle panels) and Caspase3 (green, middle panels), γ-H2AX (magenta, lower panels) and p-Chk2 (green, lower panels), and corresponding quantification of palate sections from control, Brca1 cKO, Brca2 cKO, and Brca1/2 dKO mice. The yellow box shows the high-magnification image of γ-H2AX/Caspase3- and γ-H2AX/p-Chk2-positive cells. PS, palatal shelf. Data in panels (B,D) are represented as mean ± SD, n = 3 in each group. *p < 0.05; **p < 0.01; N.S., not significant.

