
Figure 2.
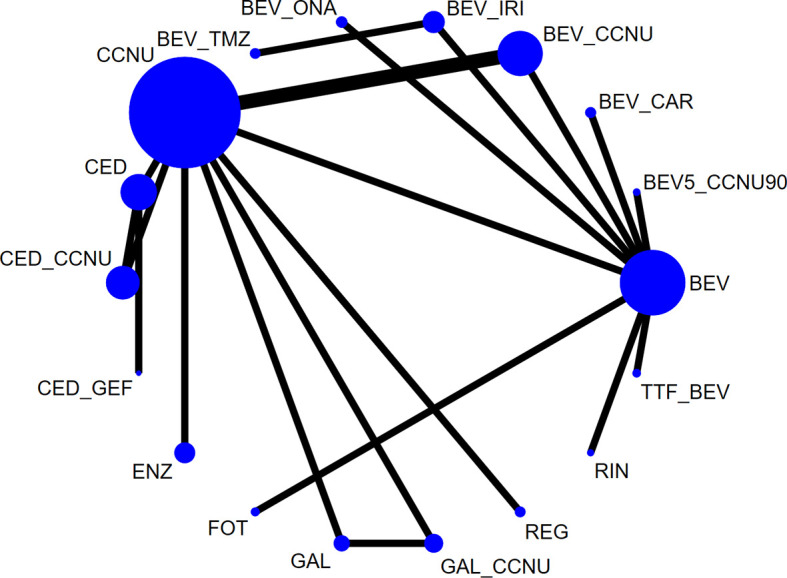
Network plot of all eligible comparisons involved. The size of every solid circle is proportional to the total sample size, and the width of the line is proportional to the number of clinical trials. Network plots of each outcome are shown in Supplementary Figures . BEV, bevacizumab monotherapy or combined with placebo; CCNU, lomustine monotherapy or plus placebo; TMZ, temozolomide; BEV_CCNU, bevacizumab plus lomustine; BV5_CCNU90, low-dose bevacizumab (5 mg/kg) plus low-dose lomustine (90 mg/m2); BEV_TMZ, bevacizumab plus temozolomide; BEV_ONA, bevacizumab plus onartuzumab; BEV_IRV, bevacizumab plus irinotecan; BEV_CAR, bevacizumab plus carboplatin; GAL, galunisertib; FOT, fotemustine; ENZ, enzastaurin; CED, cediranib; GAL_CCNU, galunisertib plus lomustine; CED_CCNU, cediranib plus lomustine; CED_GEF, cediranib + gefitinib; TTF_BEV, tumor treatment field plus bevacizumab; REG, regorafenib; RIN_BEV, rindopepimut plus bevacizumab.