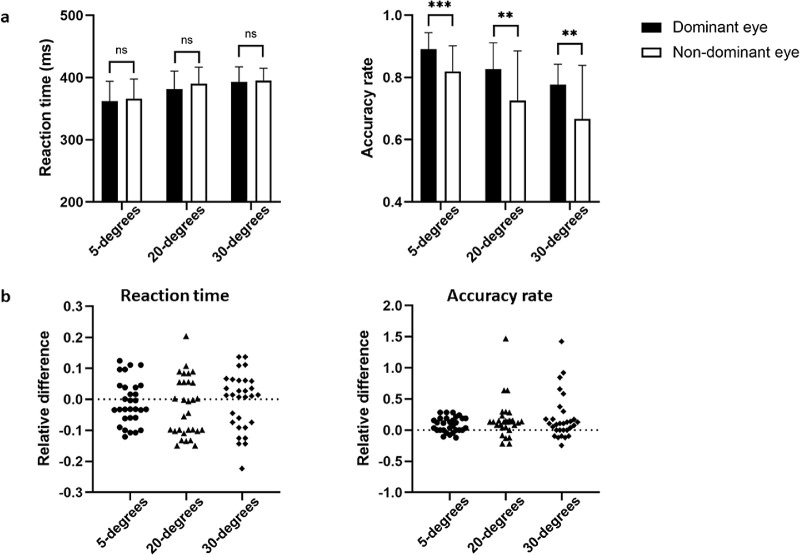
Figure 3.
Behavioral differences between the dominant and nondominant eye. (a) A plot of an absolute measure of behavioral differences between the two eyes. Data are mean ± SD. The probability levels are **P < 0.01, and *** P < 0.001. (b) A plot of a relative measure of differences between the two eyes. Circles indicate the 5° condition, triangles indicate the 20° condition, and squares indicate the 30° condition. The value of relative difference of greater than 0 indicate the percentage increase of behavioral performance in the dominant eye compared with that in the nondominant eye condition. The value of relative difference of less than 0 indicate the percentage decrease of behavioral performance in the dominant eye compared with that in the nondominant eye condition.

