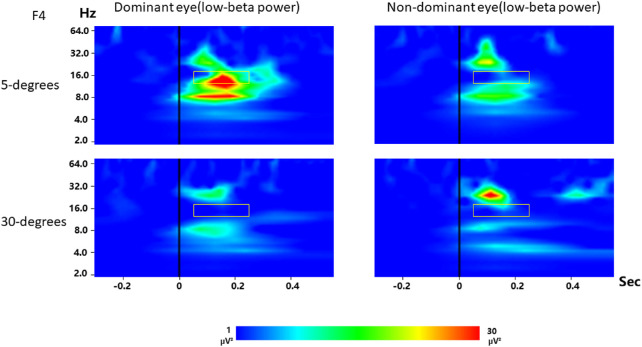
Figure 7.
Visual cortical asymmetry of the low-beta phase-locked oscillatory power within the right frontal area (F4) of DAN in the specific stimulus sizes. The left part with the same asymmetric effect was omitted. Time frequency representations of phase-locked oscillatory power averaged across 5° (top panel) and 30° stimuli (bottom panel), plotted separately for dominant eye (left panel) and nondominant eye (right panel). The black rectangles indicated the time (50–250 ms) and frequency (13–20 Hz) of interest that were submitted to the ANOVA.

