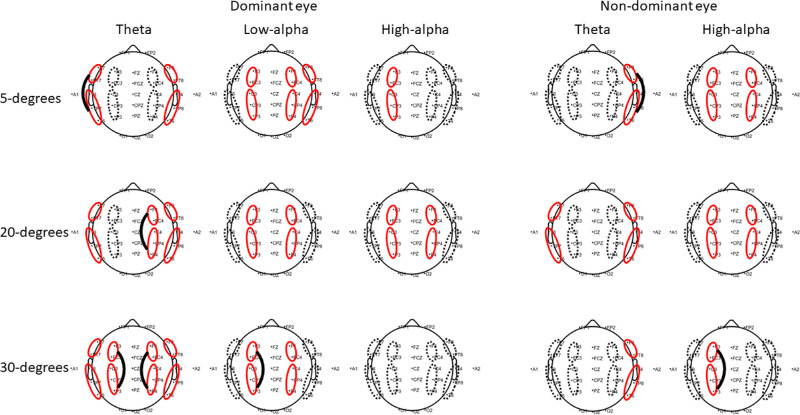
Figure 8.
Increased phase synchronization over the theta, low-alpha and high-alpha band in the dominant eye (left panel) and in the nondominant eye (right panel). PLV averaged across all trials within 5° (top panel), 20° (median panel), and 30° stimuli (bottom panel) blocks. The ellipse represents the ROI within the DAN and VAN, which turned red if it was significant between baseline PLV and post-target PLV. The thick black line indicates the condition with a larger SPLV between the dominant eye and the nondominant eye.

