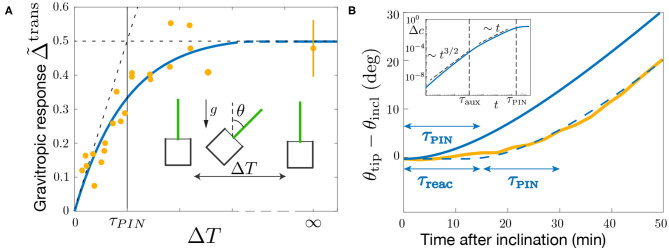
Figure 8.
Gravitropic response to a transient inclination (dose-response like protocol). (A) Maximal gravitropic response reached during the dynamics as function of the inclination time ΔT for θ = 45°. The blue solid line is the model prediction using τPIN = 13 min (τaux/τPIN = 1/2, 000 and τ1/τPIN = 0, other parameters are fixed as in Figure 7). Note that the curve is not sensitive to the exact value of τaux/τPIN and τ1/τPIN as long as these values are small. Note also that the curve does not depend on in the limiting pool regime considered. Symbols correspond to the results of Chauvet et al. (2019) obtained under normal Earth gravity (1g) and hypergravity condition (3g). (B) Evolution of the tip angle after an inclination θ = 50° predicted by the model with the same parameters (blue solid line) and in the experiments of Chauvet et al. (2016) (orange thick line). The predicted model must be shifted by a constant time τreac = 13 min to match the experimental curve (dashed blue line). Inset: early time behavior of the gravitropic response predicted by the model in log-log scale.

