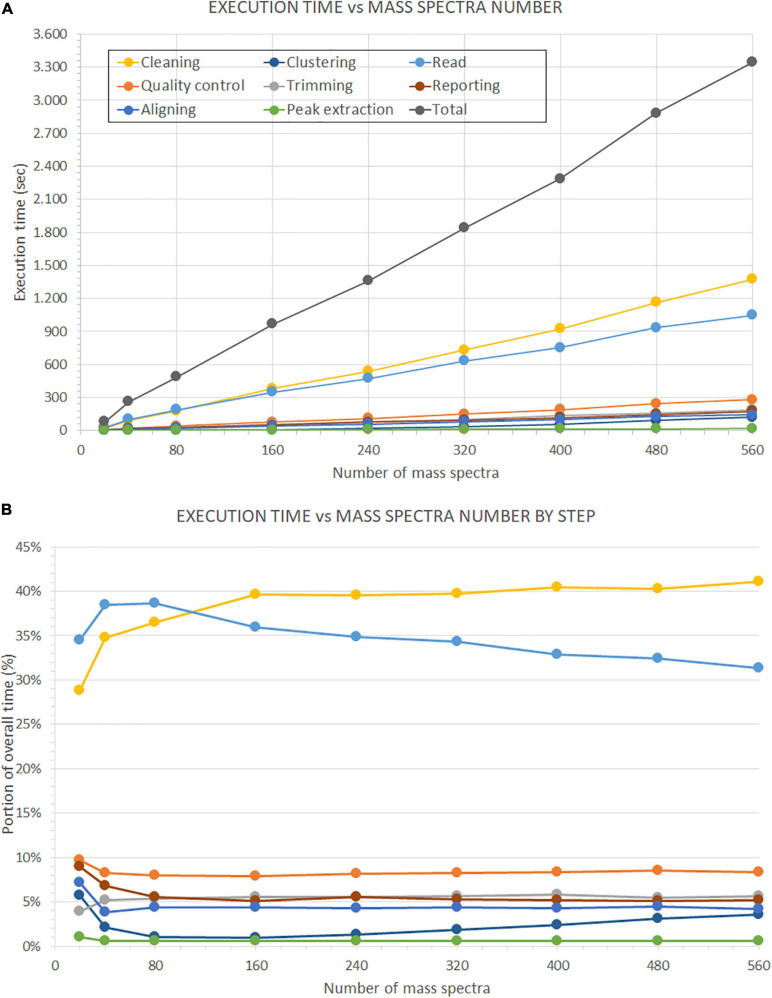
FIGURE 14.
Time performance comparison on the number of processed mass spectra. This evaluation is performed on the dataset described in Beitia et al. (2020). (A) Shows the performance of GeenaR to changes in the number of processed mass spectra. (B) Shows the impact of each step in percentage compared to the overall execution time. The legend of the colors is reported in Panel A.

