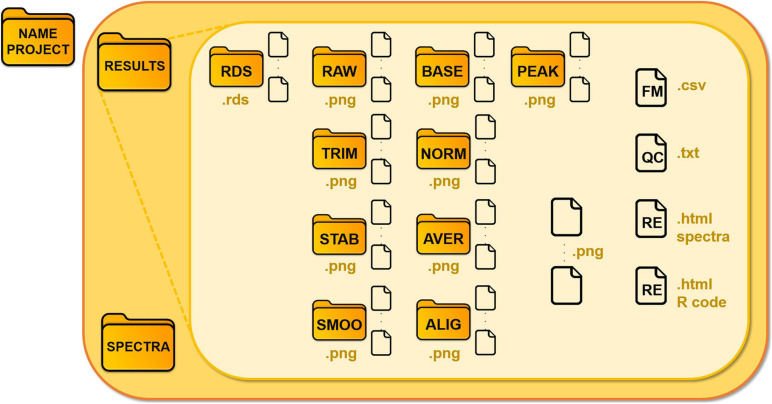
FIGURE 3.
Structure of the data folder of a project. GeenaR associates the analysis of each dataset with a project and a folder, where it locates Results and Spectra subfolders, respectively. Subfolder Spectra contains the uploaded mass spectra, subfolder Results is organized in different folders according to the steps of the analysis. The folders are: RDS for the R object files; RAW for the raw mass spectra; TRIM, for the trimmed mass spectra; STAB for the stabilized mass spectra; SMOO for the smoothed mass spectra; BASE for the corrected mass spectra; NORM for the normalized mass spectra; AVER for the averaged mass spectra (when replicates are available); ALIG for the aligned mass spectra (for samples); PEAK, for the peaks from mass spectra. Other files: FM, feature matrix; QC, quality control; RE, report.

