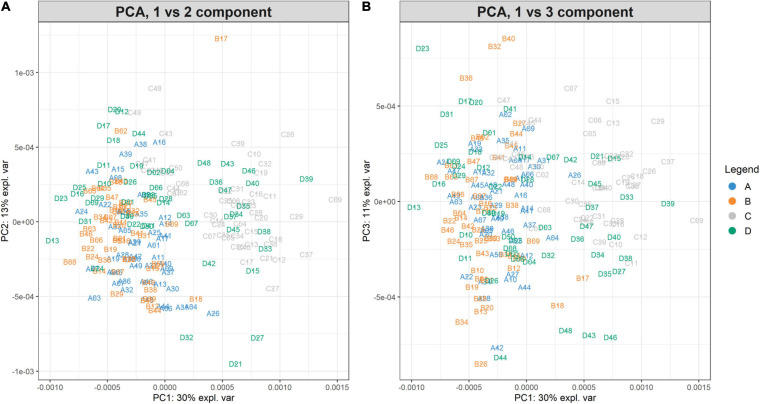
FIGURE 6.
PC1vsPC2 and PC1vsPC3 plots for Case Study 1 (ovarian cancer). The PCA analysis of the feature matrix revealed that PC1, PC2, PC3 accounted for 54% of the total explained variance. (A) Shows the projection in the PC1 versus PC2 space, (B) the projection in the PC1 versus PC3 space. Samples are colored according to their group. Ovarian cancer groups (A, B) are overlapping, whilst control groups (C, D) are not clearly overlapping, because group D is widespread.

