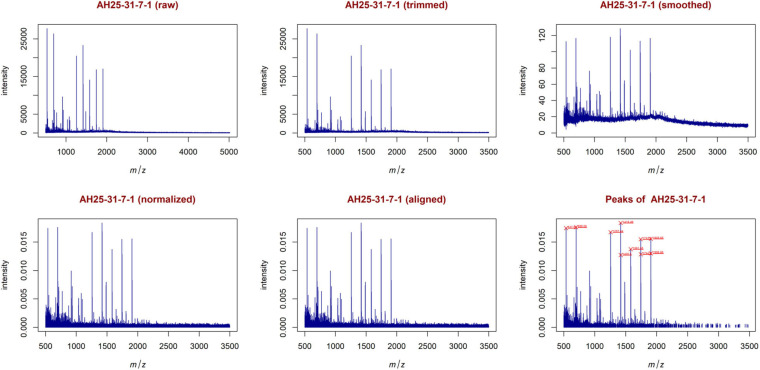
FIGURE 9.
Examples of plots created during the entire analysis for Case Study 2 (colorectal cancer). Similar to Figure 5, with sample AH25-31-7-1. The most relevant peaks with the 10 highest peaks enlighten in red are: 537.05, 699.06, 1257.44, 1419.49, 1420.50, 1581.55, 1743.60, 1744.60, 1905.65, 1906.66.

