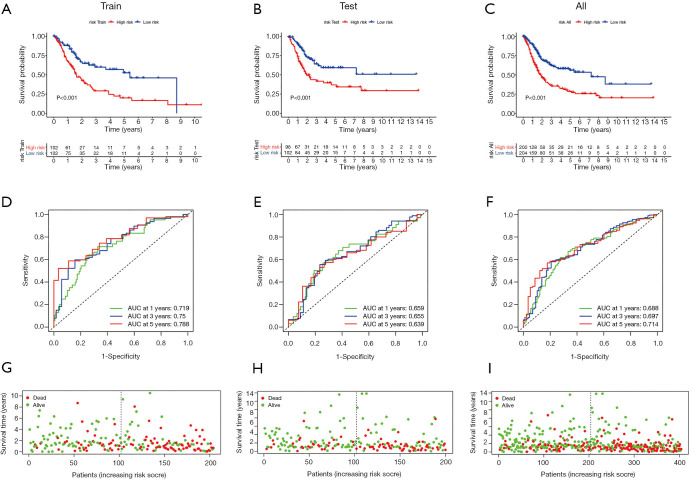
Figure 3.
Constructions of a risk model base on the genes of competing endogenous RNA network. Kaplan-Meier curves of the risk model in train cohorts (A), test cohorts (B), all samples cohorts (C); the ROC curves of 1-, 3- and 5-year in Train cohorts (D), test cohorts (E), all samples cohorts (F); the distribution of survival status in train cohorts (G), test cohorts (H), All samples cohorts (I), red and green represents of dead and alive, respectively, and the dotted lines indicate the median risk scores between low-risk and high-risk groups.

