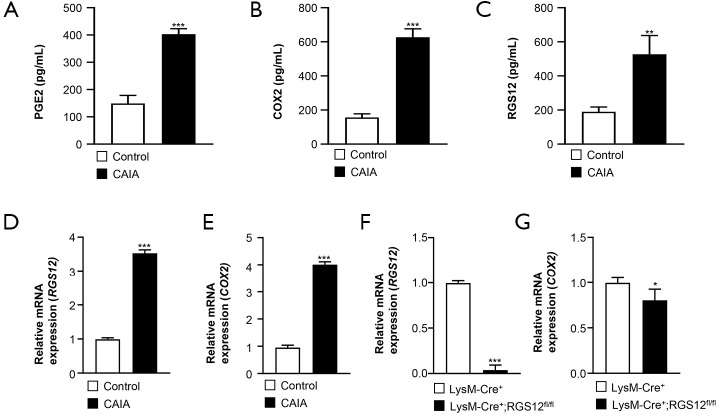
Figure 4.
The protein levels of PGE2, COX2, and RGS12 in the synovium is increased in CAIA model mice. (A,B,C) The levels of PGE2, COX2, and RGS12 in the synovium of control and CAIA model mice were analyzed by ELISA. ***, P<0.001, **, P<0.01 compared with the control group, n=5. The values are the mean ± SEM. (D,E) Analysis of RGS12 and COX2 mRNA levels in the synovium from control and CAIA mouse models. ***, P<0.001 compared with those in the control group, n=5. The values are the mean ± SEM. (F,G) Gene expression levels of RGS12 and COX2 in BMMs from LysM-Cre+ and LysM-Cre+;RGS12fl/fl mice. The data are presented as the mean ± SEM, n=5. *, P<0.05, and ***, P<0.001.

