Figure 3.
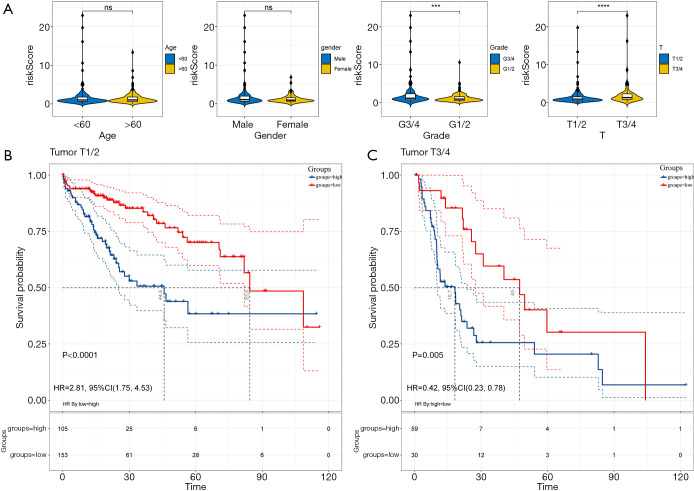
The risk score model is significantly correlated with disease progression.(A) Relationship between the risk score and different clinicopathological characteristics in the entire cohort. Statistics: Independent-sample t-test, ***P<0.001; ****P<0.0001; ns, P≥0.05. (B) Kaplan-Meier curves for overall survival between high/low-risk groups in patients with I/II stage cancer; (C) Kaplan-Meier curves for overall survival in high/low-risk groups in patients with III/IV stage cancer.

