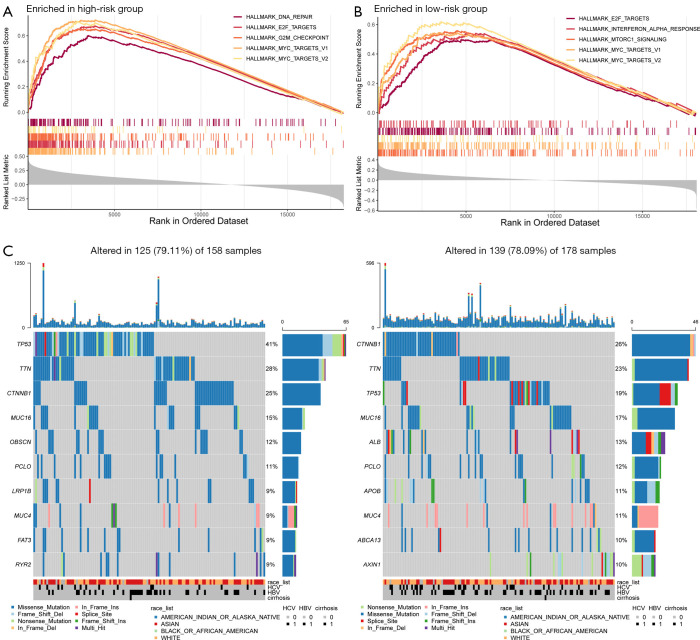
Figure 5.
Molecular characteristics of patients in the high- and low-risk groups. (A) Gene set enrichment analysis of the top five pathways significantly enriched in the high-risk group. (B) Gene set enrichment analysis of the top five pathways significantly enriched in the low-risk group. (C) Significantly mutated genes (SMGs) in HCC patients in the high- and low-risk groups. The mutated genes are sorted by mutation rate (row, top 10). The samples are arranged to highlight the mutual exclusivity between mutations. The percentage of mutations is shown on the right, and the total number of mutations is shown on the top. Color coding indicates the type of mutation.

